


The market is extremely compressed and has no clear direction. Bollinger Bands Range shows an extreme narrowing of the bands, while ADX confirms a complete lack of trend strength - a classic phase of energy buildup before a sharp expansion.
TL;DR
Bitcoin volatility has compressed to 3.8%, while ADX has fallen to 11. The market is trading within a narrow range with no sustained direction. This combination increases the likelihood of a subsequent volatility expansion but does not indicate which way the market will move.
Bitcoin: Bollinger Bands Range
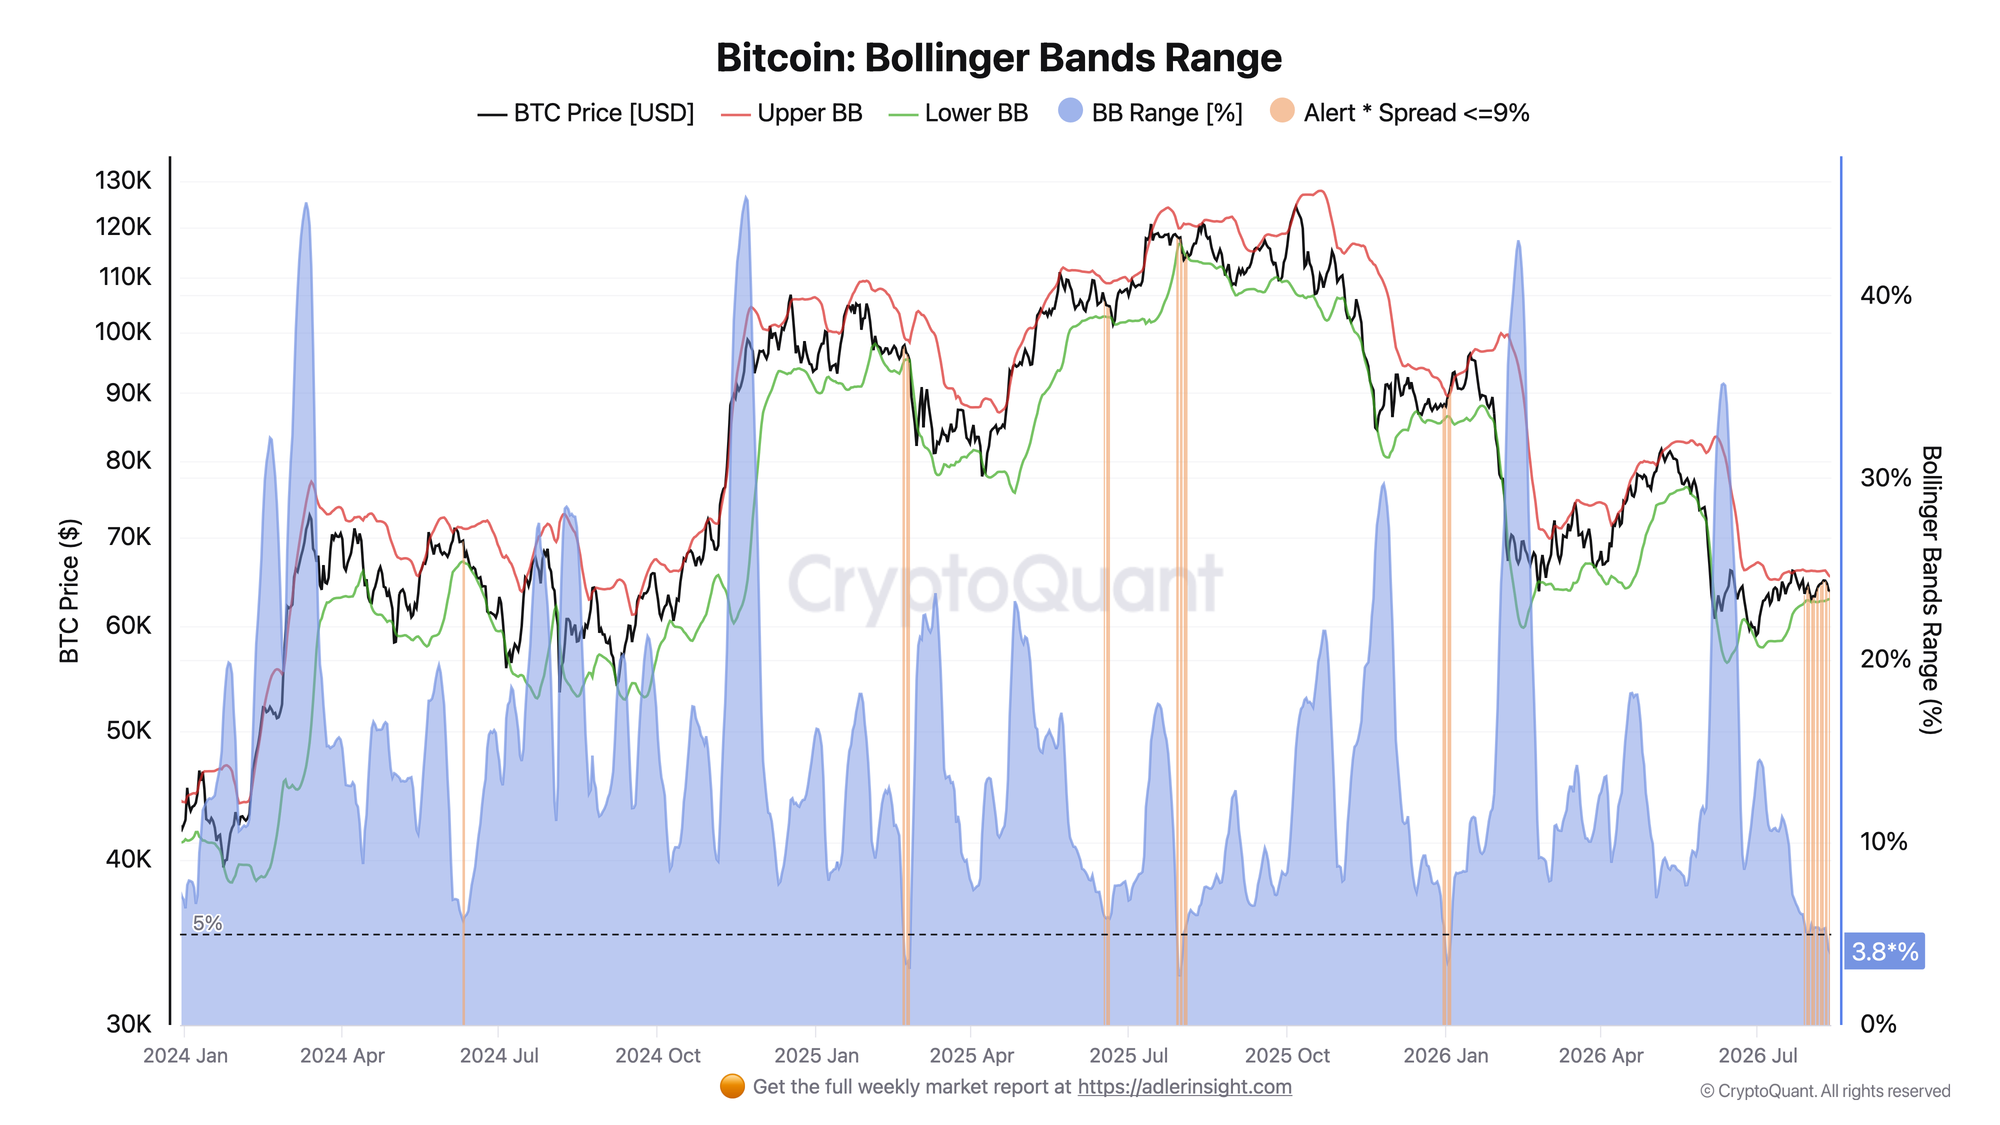
The metric measures the width between the upper and lower Bollinger Bands relative to the middle band. The lower the reading, the more compressed volatility is.
The band width currently stands at about 3.8% - one of its lowest readings in the past two years. In early July, it was still in double-digit territory.
Periods of strong band compression are followed by volatility expansion. However, Bollinger Bands Range does not indicate the direction of the next move. A rise in band width alongside a price breakout from the range would confirm an exit from the current regime.
Bitcoin Power of Trend (ADX)
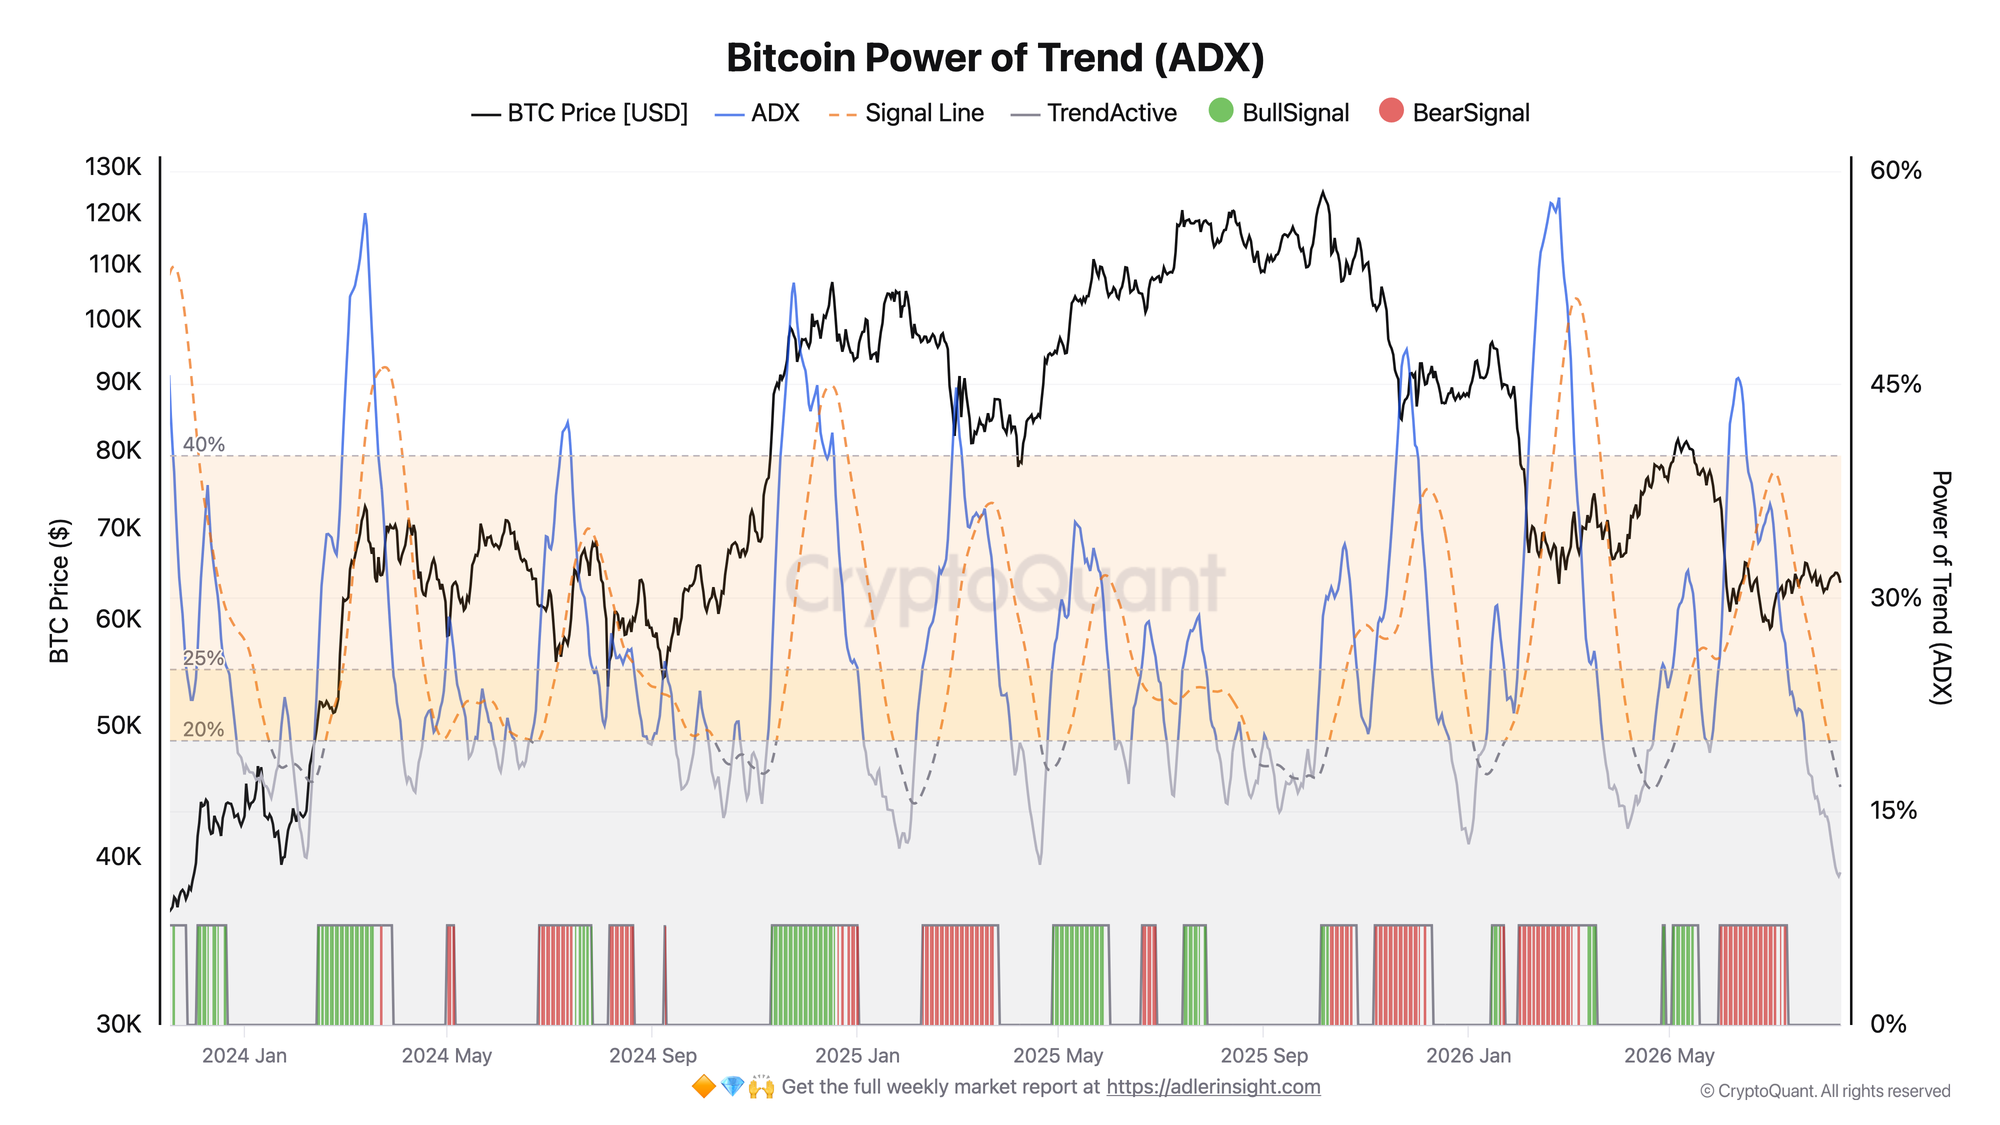
ADX measures trend strength regardless of direction, showing which side of the market is dominant.
ADX currently stands at 11 - near its lowest readings in recent years and well below the 25 threshold the model uses to identify an active trend.
TrendActive remains off. There are no active BullSignal or BearSignal readings. The last directional signal was bearish in early July, but the current market structure no longer confirms it.
This means Bitcoin is currently outside a clear trend. For a regime change, ADX must turn higher and move above 25. Direction will then be determined by the relationship between +DI and -DI: a lead of more than 5 points will activate a Bull or Bear signal.
The second chart confirms the first. Bollinger Bands show strong volatility compression, while ADX shows a lack of directional momentum. The market remains in consolidation until a new trend emerges.
The market is forming a bottom, but the best entry only comes after confirmation. Weekly Engine highlights early triggers, key levels, and scenario invalidation conditions. Try it free for 7 days.
FAQ
What does the simultaneous compression of the bands and decline in ADX indicate?
The market is trading within a narrow range without a sustained trend. This structure precedes volatility expansion but does not indicate the direction of the next move on its own.
What would signal a regime change?
An expansion in the Bollinger Bands alongside ADX rising above 25. The relationship between +DI and -DI would then show the direction: a +DI lead of more than 5 points would produce a Bull signal, while a -DI lead would produce a Bear signal.
CONCLUSIONS
Bollinger Bands Range has compressed to about 3.9%, while ADX has fallen to 11. Volatility and trend strength are both at low levels, so the current regime remains neutral.
The main trigger is BBR expanding from compression alongside ADX rising above 25 and a Bull or Bear signal appearing. Until then, Bitcoin remains in consolidation, and the risk of false breakouts persists.
Both indicators point to the same conclusion today: the market is extremely compressed and has no clear direction. Bollinger Bands Range shows an extreme narrowing of the bands, while ADX confirms a complete lack of trend strength - a classic phase of energy buildup before a sharp expansion.
Live Charts
Explore the metrics behind this brief with live, auto-updating charts:
Bitcoin Analysis Framework - Multi-layer decision stack for cycle position, participant behavior, and momentum timing.
Open Interest (BTC) - Total futures positioning and 7-day BTC-denominated change.
Funding Rates - Perpetual futures funding to track long-side or short-side leverage pressure.
Fear & Greed Index - Composite market sentiment for risk appetite and sentiment extremes.
MVRV Ratio - Market value vs realized value to identify valuation regimes and cycle risk.