


The newest cohort of Bitcoin holders has recovered to nearly breakeven, while coins aged 3-6 months remain much deeper in unrealized loss. At the same time, this cohort's Realized Cap is nearly 70% below its own peak. Both metrics point to the same area of elevated stress - holders of coins aged 3-6M.
TL;DR
The 0-3M cohort has climbed to nearly breakeven, while 3-6M remains deeper underwater. The 3-6M NUPL stands at -0.14, while its Realized Cap is 69.6% below its all-time high. The main stress among young coins is now concentrated not among the newest buyers, but in the next age group.
Bitcoin 0-3M vs 3-6M Holder NUPL
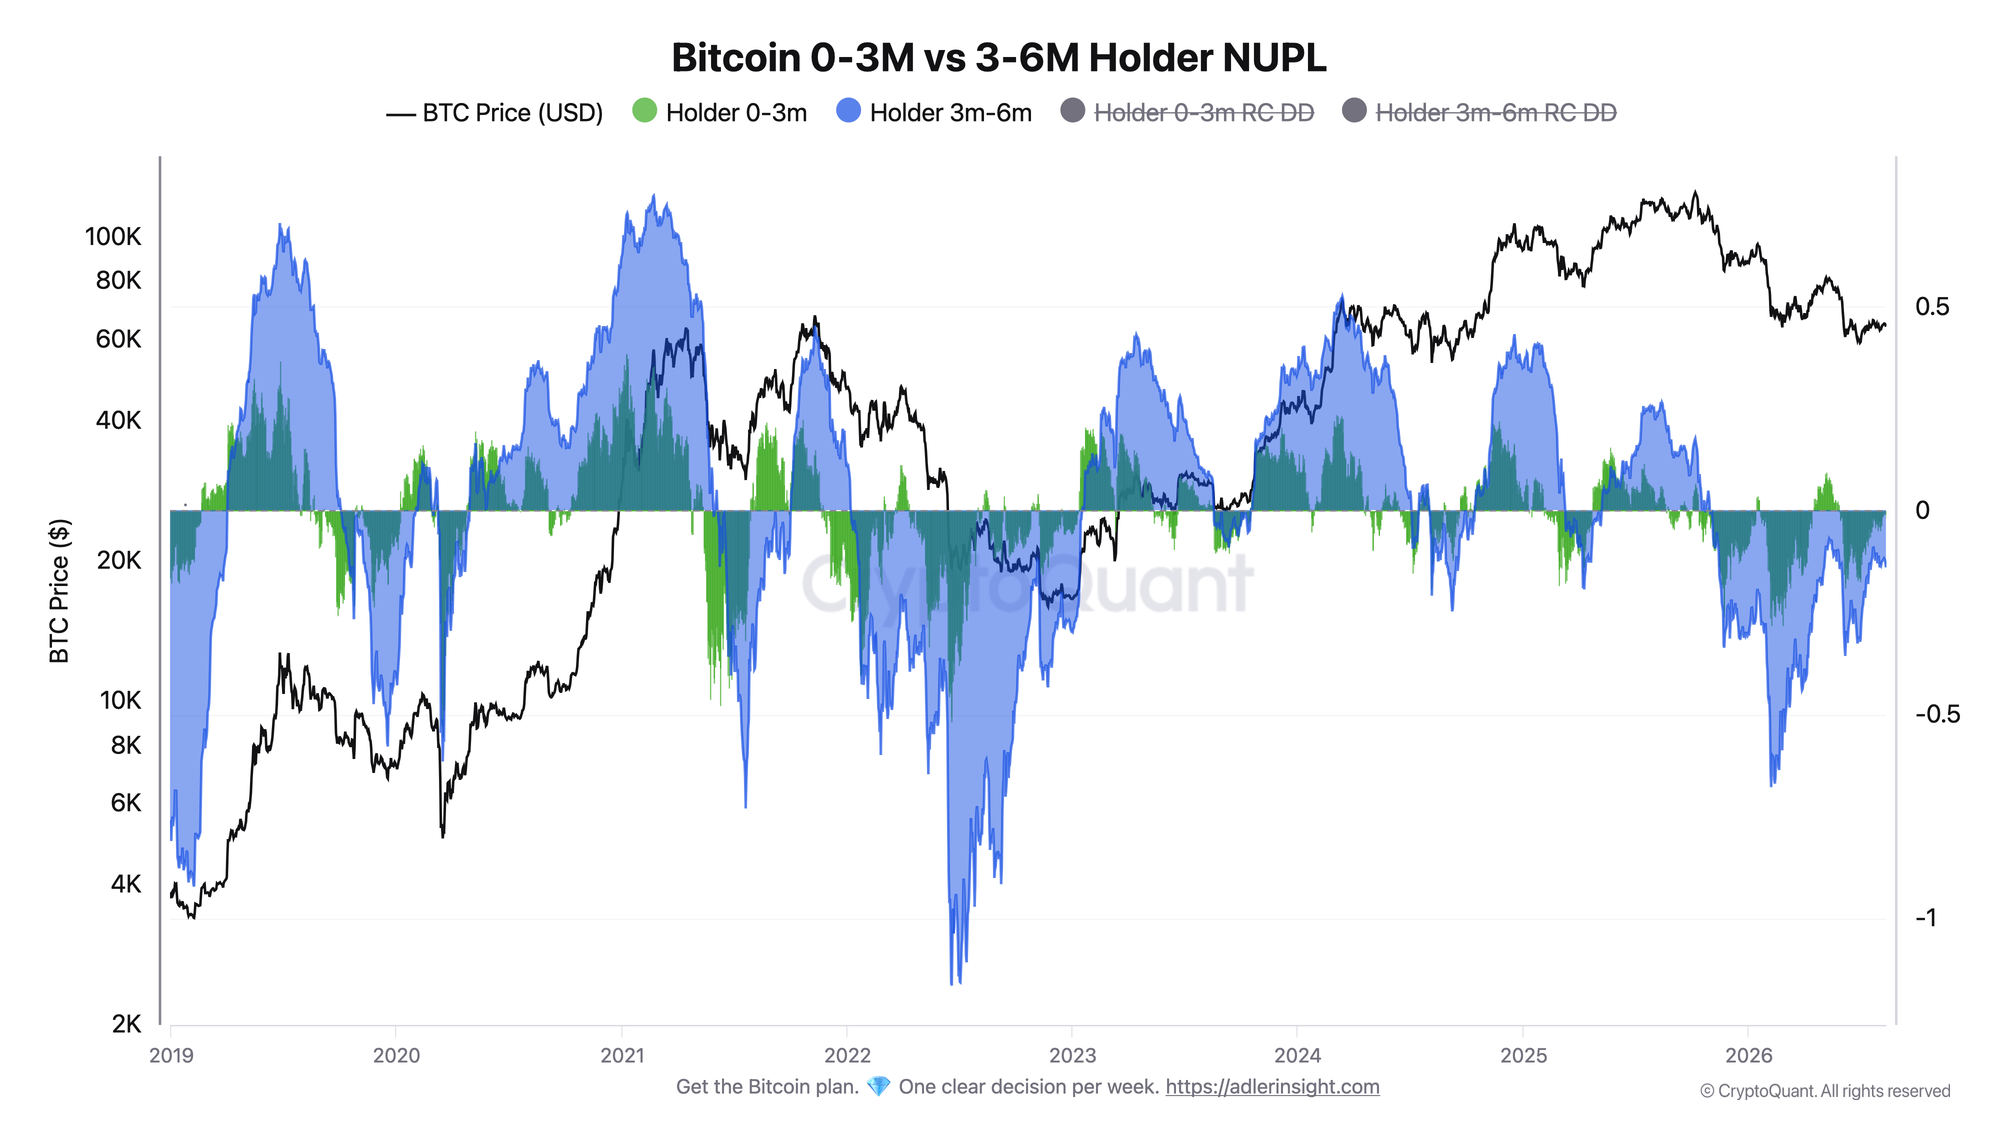
NUPL measures unrealized profit or loss relative to the acquisition cost of coins within each age cohort.
Both cohorts remain below zero, but the gap between them has become clear. The 0-3M NUPL has risen to -0.02 and is nearly back at breakeven, while 3-6M remains at -0.14. Over the past two months, the 0-3M reading has recovered from -0.13 in June to nearly zero. The 3-6M cohort has also rebounded from its June lows but remains much deeper in loss.
This means the current price is already close to the average acquisition cost of the newest coins, while holders of coins aged 3-6 months are still sitting on a larger unrealized loss on average.
The key trigger for improvement is a return of the 3-6M NUPL above zero. A reversal in the 0-3M NUPL below -0.10 would mean that significant unrealized stress is spreading back to the newest coins.
Bitcoin 0-3M vs 3-6M Holder Realized Cap Drawdown
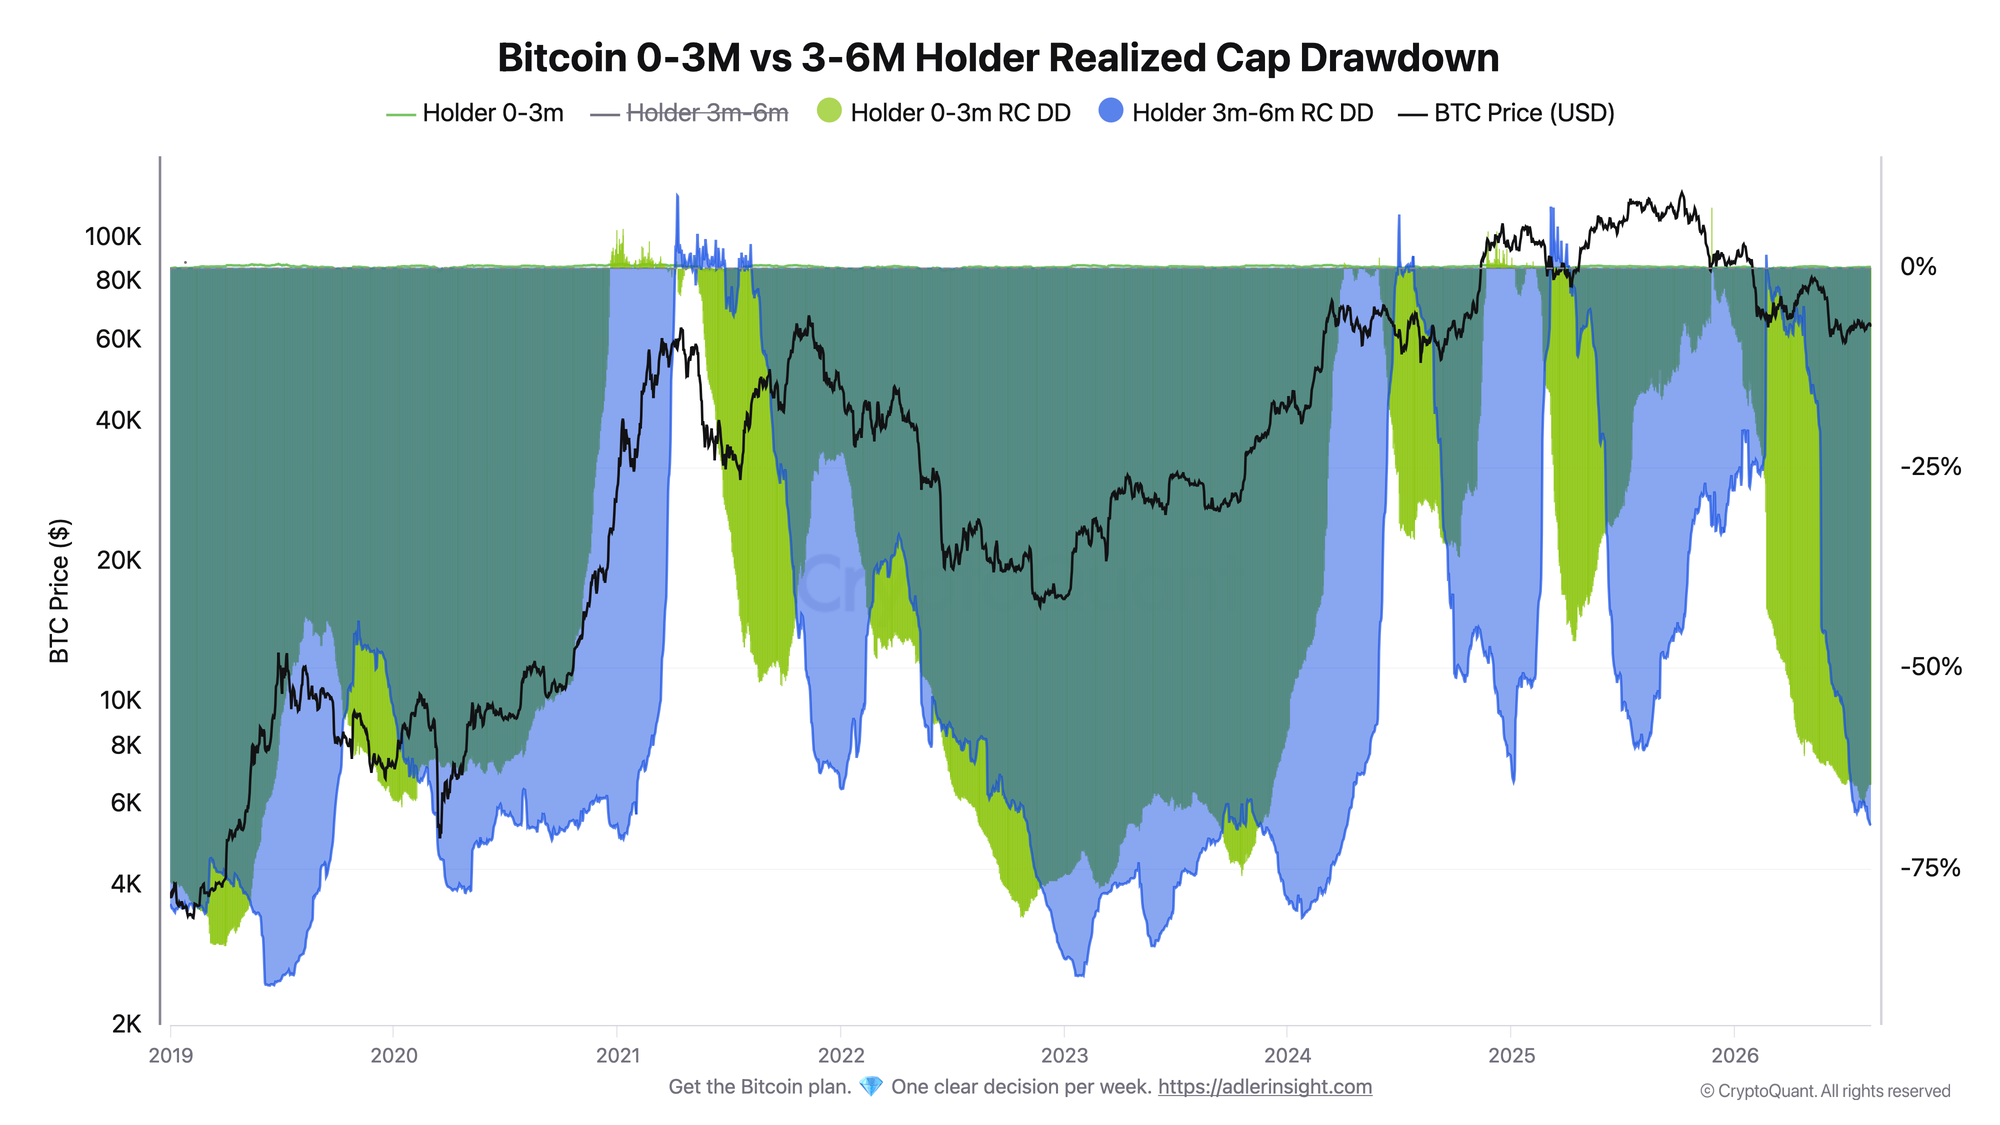
Realized Cap Drawdown shows how far the current realized capitalization of each age cohort is below its previous peak.
For the 0-3M cohort, the reading has remained around -64% in recent months. The 3-6M drawdown continues to deepen, from -53% in mid-June to -69.6% now. This is its lowest reading in the past 90 days. The gap between the cohorts is 5.6 percentage points, with 3-6M experiencing the deeper drawdown.
Realized Cap Drawdown should not be confused with a direct measure of realized losses or capital outflows. Age cohorts constantly change: coins move from 0-3M into 3-6M and then leave the 3-6M range. The metric therefore shows how far the current realized value within a specific age group has moved from its own peak.
Still, the 3-6M trend remains weak. Its Realized Cap continues to move farther from its previous peak while the same cohort's NUPL remains well below zero. A sustained upward reversal in the 3-6M Realized Cap Drawdown would mark an improvement. A continued move below -70% would show further weakening in this age group relative to its previous peak.
Together, the two charts provide a more precise picture. NUPL shows that 0-3M is nearly back at breakeven, while 3-6M remains deeper in unrealized loss. Realized Cap Drawdown adds a second layer: the capital value assigned to the 3-6M cohort is much farther from its own peak and continues to decline relative to it.
Reading the signal is not enough - you need to act on it. Weekly Engine turns on-chain data into one clear decision per week, with risk caps and invalidation built in. Start free.
FAQ
What does it mean that the 3-6M cohort is deeper in loss than 0-3M? Its NUPL is lower, which means the average acquisition cost of these coins is above the current market price. The 0-3M cohort is nearly back at breakeven, while 3-6M remains well underwater.
Does a Realized Cap Drawdown of -69% mean the cohort has lost nearly 70% of its capital? No. It means the current Realized Cap of the 3-6M age group is 69% below its previous peak. Its movement is affected not only by acquisition prices but also by the constant movement of coins between age cohorts.
CONCLUSIONS
The main unrealized stress among young coins is now concentrated in the 3-6M cohort. Its NUPL stands at -0.14, compared with -0.02 for 0-3M. At the same time, the 3-6M Realized Cap is 69.6% below its own peak, compared with 64% for the newest cohort.
The recovery of 0-3M to nearly breakeven is constructive, but it has not yet spread to the next age group. For a broader improvement, the 3-6M NUPL must return above zero, while its Realized Cap Drawdown must stop deepening and begin a sustained recovery.
Live Charts
Explore the metrics behind this brief with live, auto-updating charts:
NUPL - Net unrealized profit/loss across holders, mapped into cycle sentiment phases.
Supply in Loss - Share of supply held at a loss to flag stress and capitulation zones.
STH-SOPR - Short-term holder profit/loss behavior around the 1.0 breakeven threshold.
Realized Price - Aggregate on-chain cost basis compared with BTC price and long-term trend.
Holder Behavior - All holder profitability and supply-cohort charts in one view.