


Bitcoin's valuation has fallen into the lower end of its historical range, but the price remains about 13.3% above investors' adjusted average cost basis. The first chart shows the depth of the valuation compression, while the second translates it into specific price levels and marks the boundary between the current correction and deep market stress.
TL;DR
MVRV Z-Score has fallen to 0.41, well below its mean of 1.69, but remains above zero. Bitcoin is trading at $65,249 against an adjusted realized price of $57.6K. This confirms a sharp market cooldown without broad capitulation. Losing $57.6K would significantly weaken the market structure, while a move toward $52K would push the market into a deep-stress zone.
Bitcoin MVRV Z-Score
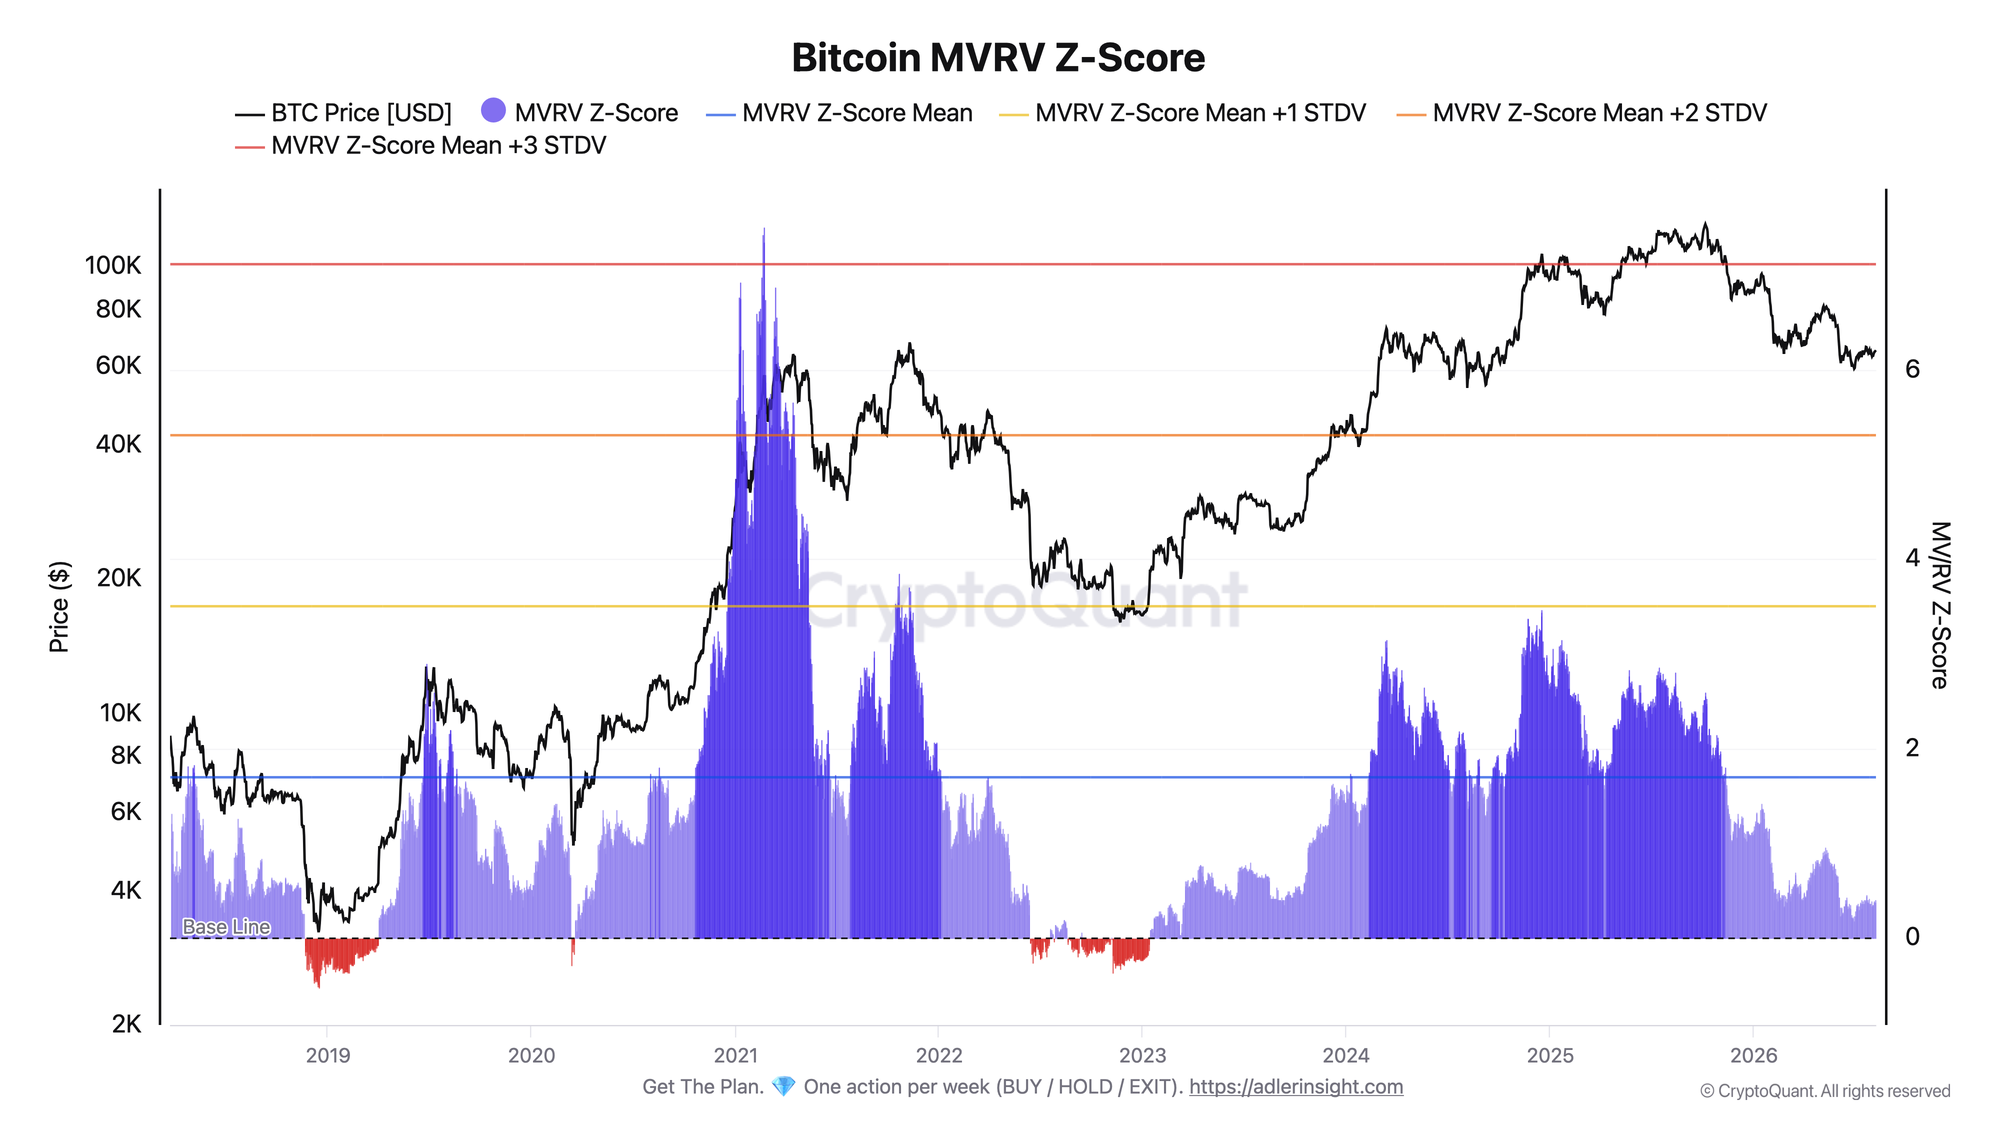
MVRV Z-Score measures the difference between market capitalization and realized capitalization, adjusted for the historical volatility of market capitalization. The higher the reading, the further Bitcoin's valuation has moved above the market's average cost basis.
The Z-Score currently stands at 0.40 against a mean of 1.69. Since mid-2025, when the metric hovered around 2.5 with Bitcoin trading above $100K, the valuation has steadily compressed. The metric reached a summer low of 0.18 before recovering to its current level.
The market remains far from the overheated regions one and two standard deviations above the mean. The metric also remains above the zero line. In previous cycles, negative readings accompanied periods of deep undervaluation and severe stress.
The current valuation is moderately low by historical standards, but not yet extreme. A drop below zero would confirm further deterioration, while a return to the mean of 1.69 would indicate renewed valuation expansion.
Bitcoin Adjusted Realized Price Bands (Alive Coins)
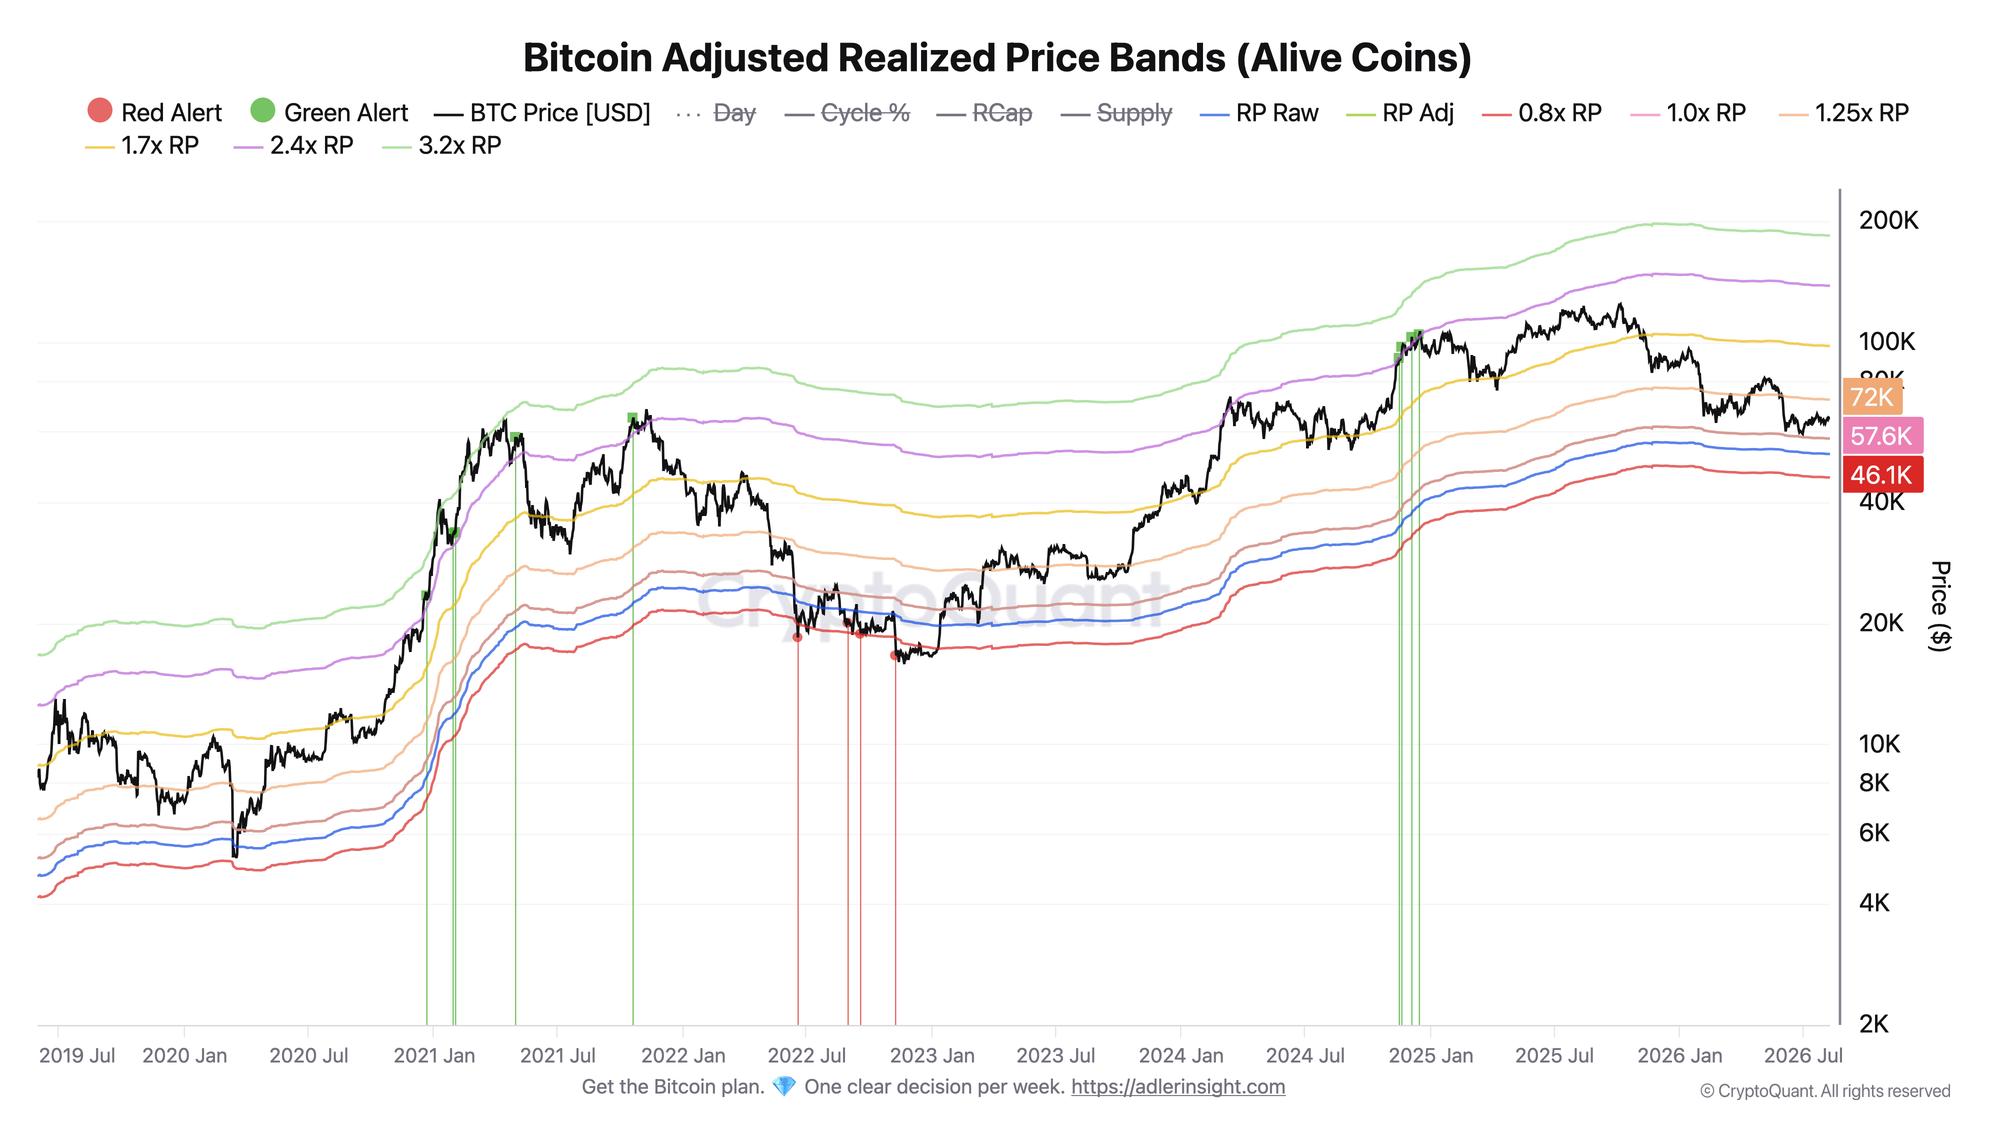
The bands are based on the adjusted realized price, which reflects the average cost basis of active coins. They translate market valuation into specific price levels.
Bitcoin is trading at $65,249, 13.3% above the 1.0x band at $57.6K. The price remains below the 1.25x band at $72K.
The first critical threshold is $57.6K. A drop below it would mean the market is trading under the average cost basis of the active supply. The 0.8x band sits at $46.1K, 20% below the average cost basis and 29.3% below the current price. This is a reference point for a deep-stress zone, not an exact capitulation threshold.
As long as Bitcoin holds above $57.6K, the market structure remains consistent with a prolonged correction. Losing this level would increase pressure and open the way toward $46.1K. A sustained break above $72K would confirm a recovery in valuation.
Both charts point to the same market state. MVRV Z-Score shows a sharp valuation cooldown, while the price bands confirm that Bitcoin is still trading above the average cost basis. The market has weakened but has not yet entered a deep-stress regime.
Invest in Bitcoin with discipline, not emotion. Start free and follow a clear, rules-based system built to keep fear, FOMO, and panic selling out of every decision.
FAQ
Does an MVRV Z-Score in the neutral zone mean the bottom is already in?
No. A reading of 0.41 indicates an absence of overheating, but it does not confirm a final bottom. Bitcoin can remain in this area for a long time without establishing a clear direction.
What level separates a correction from capitulation?
There is no exact threshold. Losing the 1.0x band at $57.6K would mark the first serious deterioration, as the price would fall below the average cost basis. The 0.8x band at $46.1K marks a deep-stress zone where the risk of capitulation rises substantially.
CONCLUSIONS
An MVRV Z-Score of 0.40 and a 13.3% price premium to the adjusted realized price describe a market that has cooled but has not broken down. These metrics do not confirm a bottom, while broad capitulation is not yet visible.
The main risk level is $57.6K. Losing it would push the price below the average cost basis and increase the probability of a move toward the $46.1K stress band. To confirm strength, Bitcoin needs to hold above $72K and MVRV Z-Score must return to its mean of 1.69.
Live Charts
Explore the metrics behind this brief with live, auto-updating charts:
Realized Price Bands - Dynamic realized-price valuation zones from live BTC price and on-chain cost basis.
MVRV Ratio - Market value vs realized value to identify valuation regimes and cycle risk.
Realized Price - Aggregate on-chain cost basis compared with BTC price and long-term trend.
CVDD - Cumulative Value Days Destroyed as a deep-value floor and historical accumulation band.
Bitcoin Analysis Framework - Multi-layer decision stack for cycle position, participant behavior, and momentum timing.