


The market shows an unusual combination: the share of holders in profit remains in the lower part of its multi-year range, while on-chain activity has already recovered noticeably. Coins are moving more actively again, even though the financial position of a significant portion of the supply remains weak.
TL;DR
This brief examines the gap between holder conditions and network activity. The share of coins in profit remains near local lows, but transfer volume has risen 23% from its April bottom and moved above its yearly average. The network is recovering faster than holder profitability, although these data alone cannot determine whether the movement of coins reflects accumulation, capitulation, or new demand.
Bitcoin UTXOs in Profit (%)
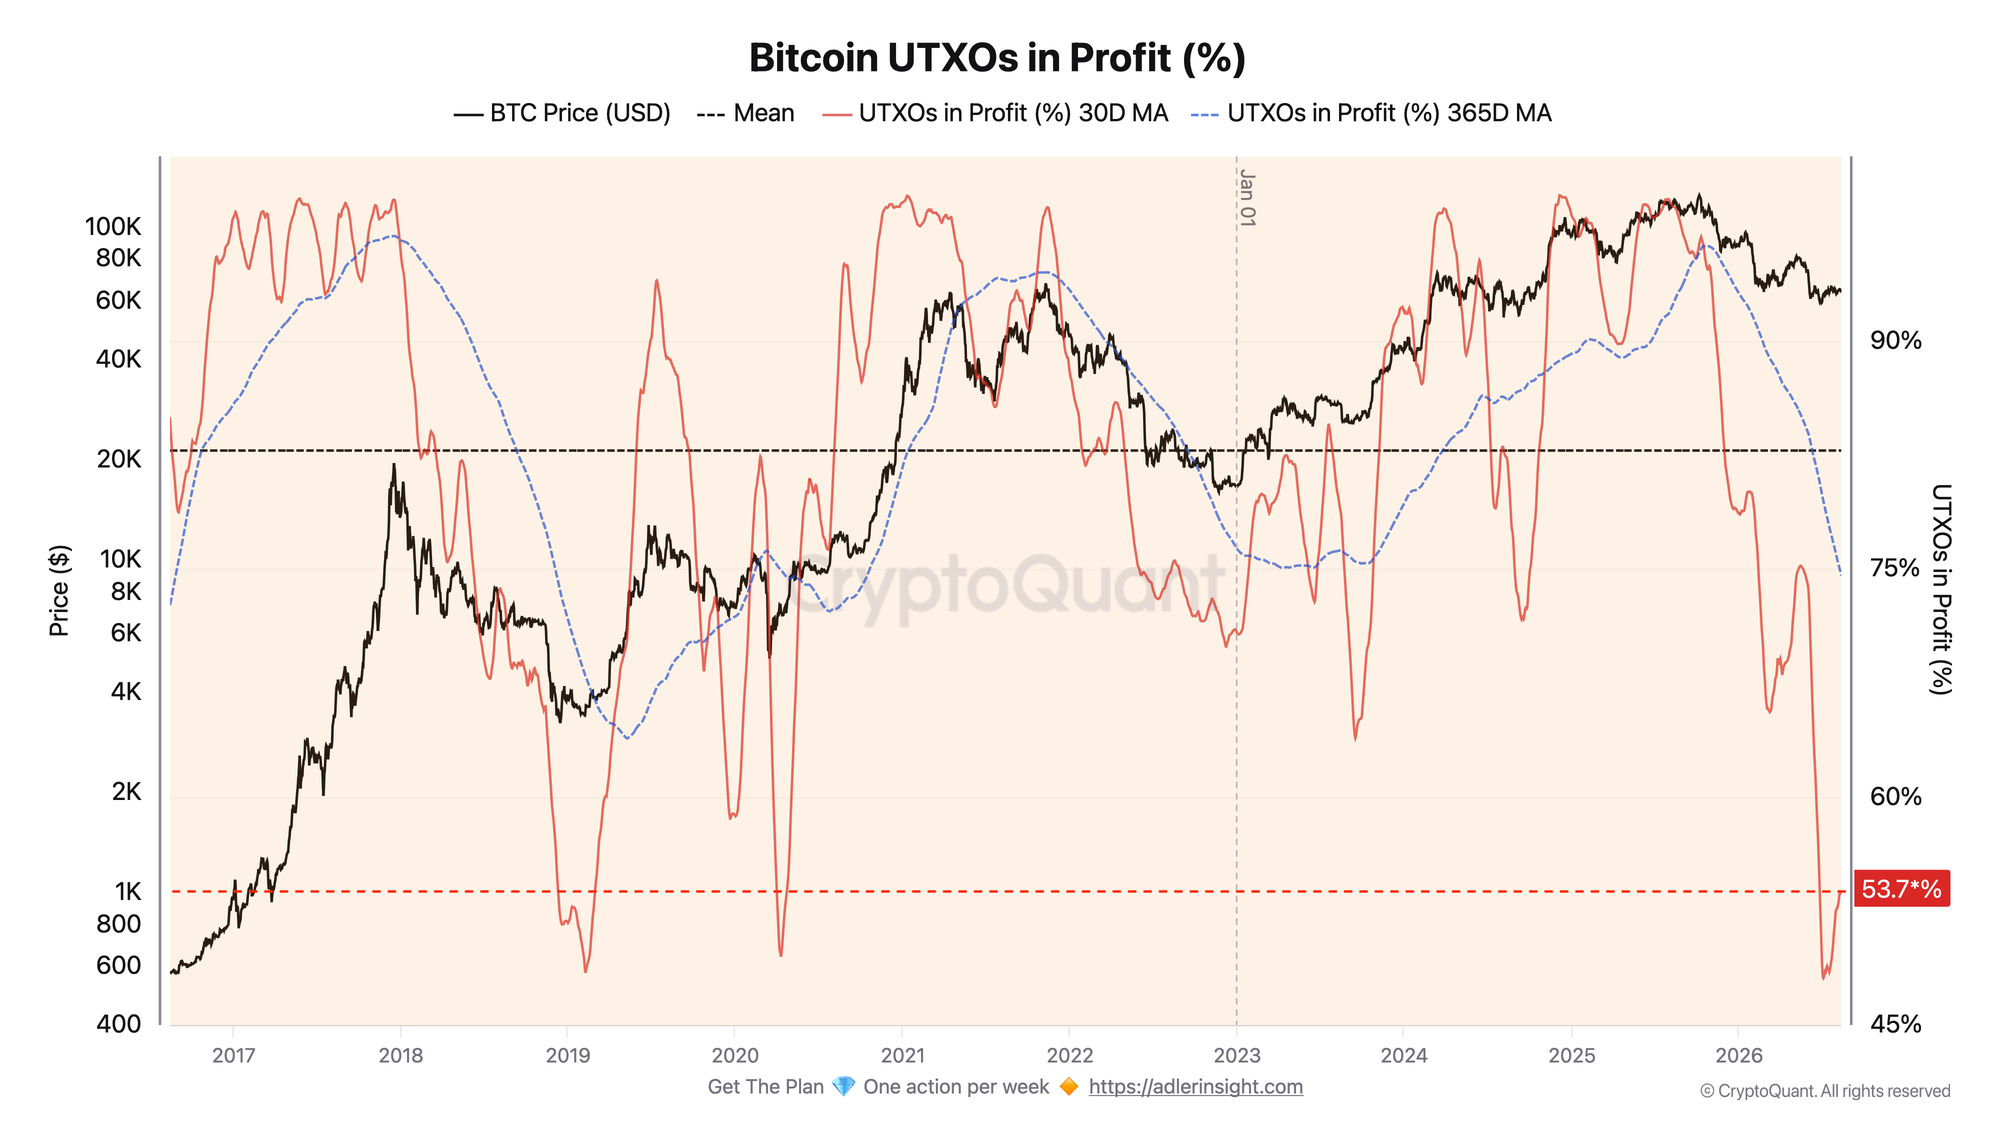
The metric shows the share of UTXOs whose current market price is above the price at which they last moved.
The 30-day average stands at 53.7%, well below the 10-year average of about 82.8% and the yearly average of 74.6%. From around 75% in May, the metric fell to a low of 48% in early July and only then began to recover. Over the same period, the price dropped more than 20% from its May level of $80K to $63.5K, pushing a significant portion of the supply into an unrealized loss.
The current reading remains in the lower part of its multi-year range and points to continued stress among holders. At the same time, the rebound from 48% shows that holder profitability is no longer deteriorating at the same pace. A sustained rise in the metric would provide a stronger sign of normalization, while another move below the July low would indicate a renewed increase in the share of supply at a loss.
Bitcoin Total Transfer Volume
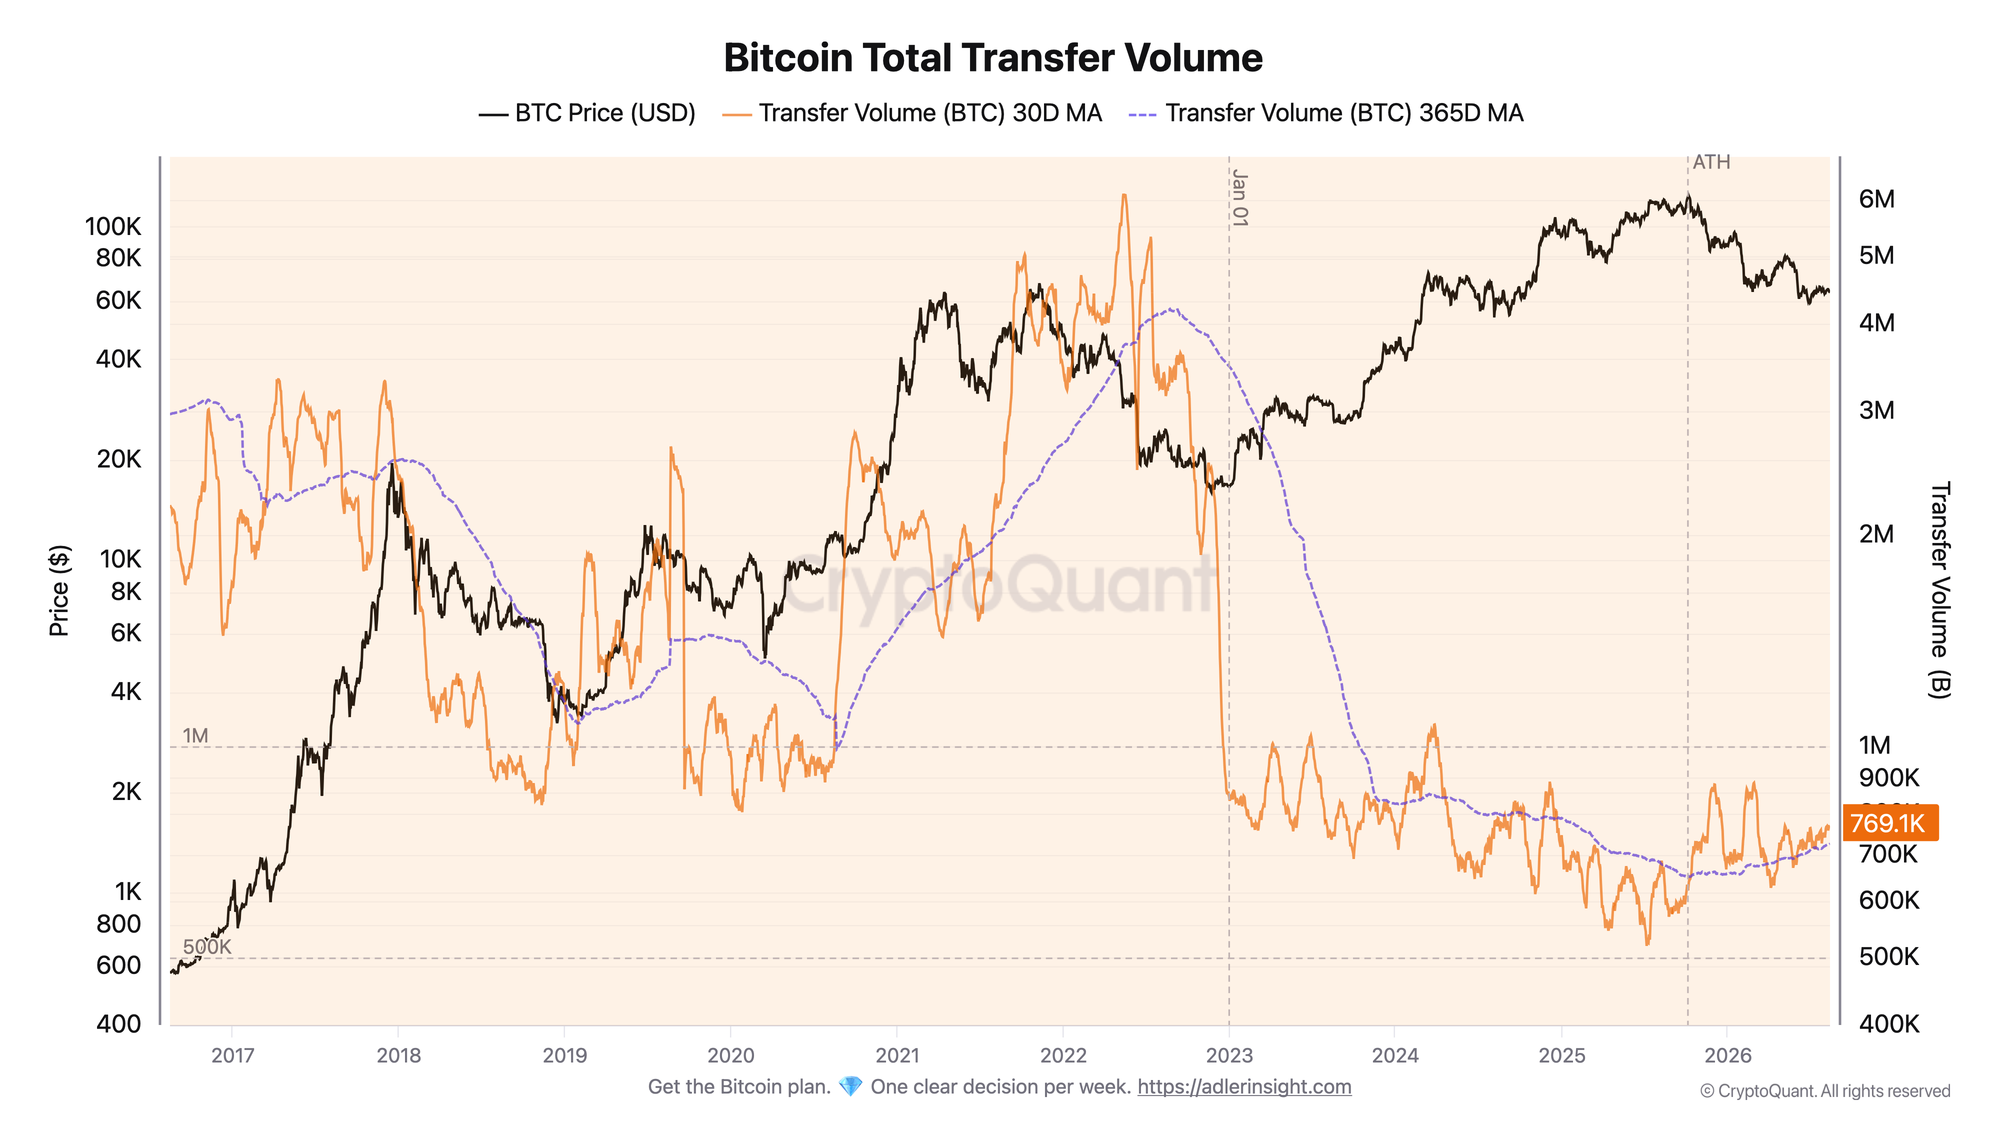
The metric tracks the total volume of BTC transferred across the network, smoothed by moving averages.
The 30-day average transfer volume has risen 23%, from its April low of 627.7K BTC to the current 769.1K BTC. At the same time, the metric has moved above the 365-day average of 725K BTC. Short-term network activity now exceeds its own yearly baseline.
This marks an important change from the spring: despite weak holder profitability, the volume of coins moving across the network has already recovered. However, Total Transfer Volume only shows the scale of BTC movement. It cannot determine who is transferring the coins, where they are going, or whether they are moving at a profit or a loss.
The main feature of the current market is that both indicators have recovered from their local lows, but at different speeds. Network activity has moved back above its long-term baseline, while the share of coins in profit remains far below its norm. In other words, coin movement across the network is recovering faster than holder conditions
Outperform Buy & Hold with a rules-based strategy - Start free. One weekly action, clear triggers, and invalidation levels. No guessing.
FAQ
Why can't rising network activity automatically be considered a bullish signal? Total Transfer Volume shows the volume of BTC moving across the network, but not its direction or economic purpose. The increase may reflect new demand, redistribution, selling, internal transfers, or other types of activity. A stronger market recovery would require both network activity and holder profitability to rise together.
What would signal further improvement? A stronger picture would emerge if the share of coins in profit continued to rise steadily while transfer volume remained above its yearly average. This would mean that the recovery in network activity was beginning to coincide with improving holder conditions. The opposite scenario would be another drop in the share of coins in profit below its July low near 48%.
CONCLUSIONS
The two charts show different rates of recovery. The share of coins in profit remains low at 53.7%, well below its yearly and 10-year averages, while 30-day transfer volume has risen 23% from its April low to 769.1K BTC and is already above the 365-day average.
The key signal is that on-chain activity is recovering faster than the share of coins in profit. BTC movement across the network is picking up even though a significant portion of coins remains at a loss. The next stage of recovery will require growth in network activity to be accompanied by a sustained increase in the share of coins in profit.
Live Charts
Explore the metrics behind this brief with live, auto-updating charts:
Supply in Profit - Share of circulating supply in profit as a cycle-phase and euphoria gauge.
Supply in Loss - Share of supply held at a loss to flag stress and capitulation zones.
SOPR - Spent Output Profit Ratio shows whether moved coins realize profit or loss.
NUPL - Net unrealized profit/loss across holders, mapped into cycle sentiment phases.
Holder Behavior - All holder profitability and supply-cohort charts in one view.