


Fees as a share of miner revenue have fallen to late-2015 levels, while hashrate is down 23% from its October peak. Over the same period, Bitcoin's price fell 49%. Mining power is declining as mining economics deteriorate, but it remains far more resilient than the price itself.
TL;DR
Fees account for only 0.71% of miner revenue, nearly matching the level recorded in December 2015. The 7D MA hashrate is down 23% from its October peak, while Bitcoin has lost about half its value. Pressure on miners is clear, but there is no sharp capitulation in hashrate yet.
Bitcoin Miner Fee Revenue Share (30D MA)
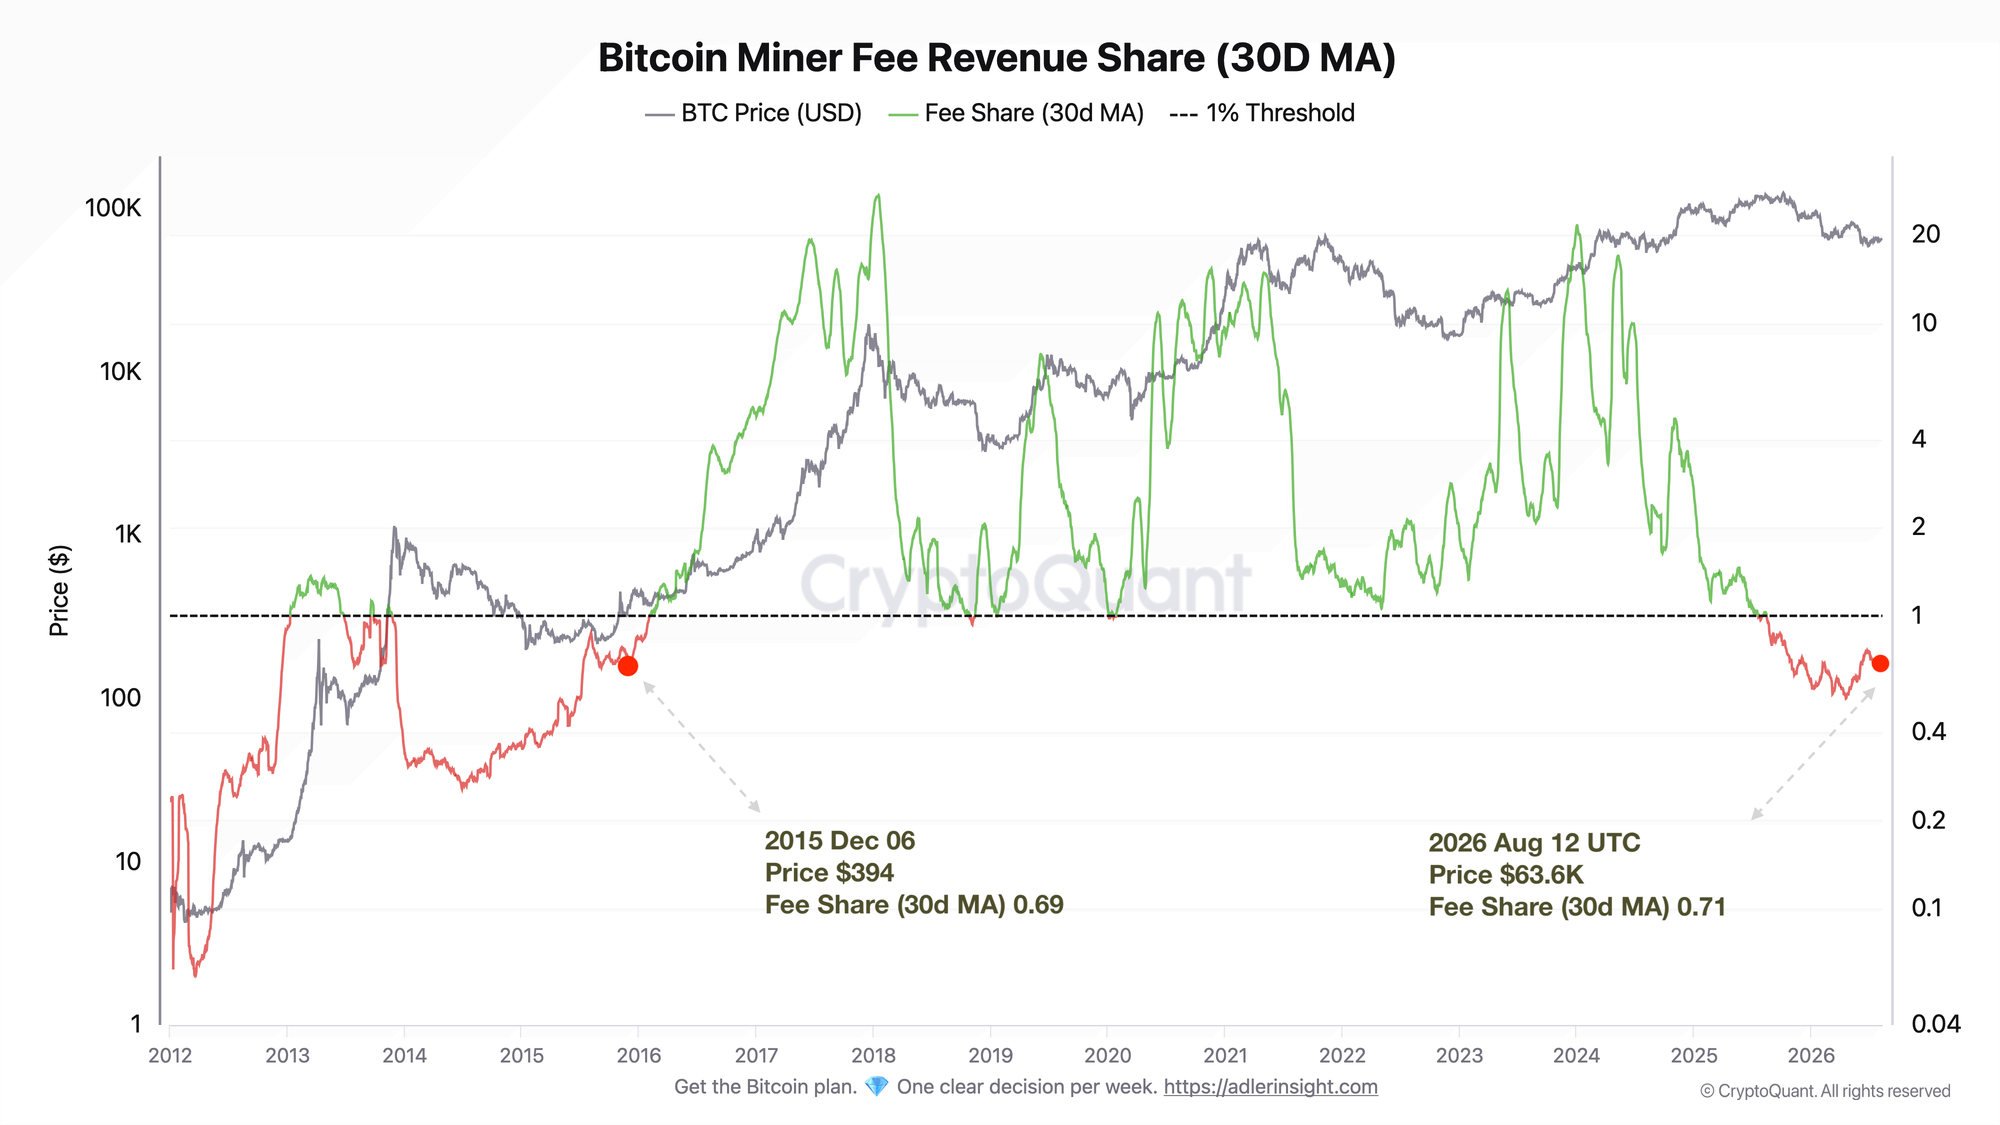
The metric shows the share of total miner revenue generated by transaction fees. The reading is smoothed using a 30-day moving average. The 1% level on the chart serves as a visual boundary between a higher and lower contribution from fees.
Fee Revenue Share (30D MA) currently stands at 0.71%. The nearest historical point on the chart is December 6, 2015, when the reading was 0.69% and Bitcoin traded at around $394.
One caveat matters here. A matching fee share does not mean today's fee market is identical to that of 2015. The block reward was 25 BTC then and is 3.125 BTC now. The two periods therefore cannot be compared directly in terms of absolute blockspace demand. The historical parallel applies specifically to the structure of miner revenue: fees accounted for a very small share then, just as they do now.
Since mid-2025, the 30-day average has remained near or below 1%. This points to weak fee pressure and low competition for blockspace. The block subsidy once again accounts for nearly all miner revenue.
A regime change would require Fee Revenue Share to rise and remain above 1%. This would show that fees are starting to play a more meaningful role in mining economics.
Bitcoin Miners Hashrate (7D MA)
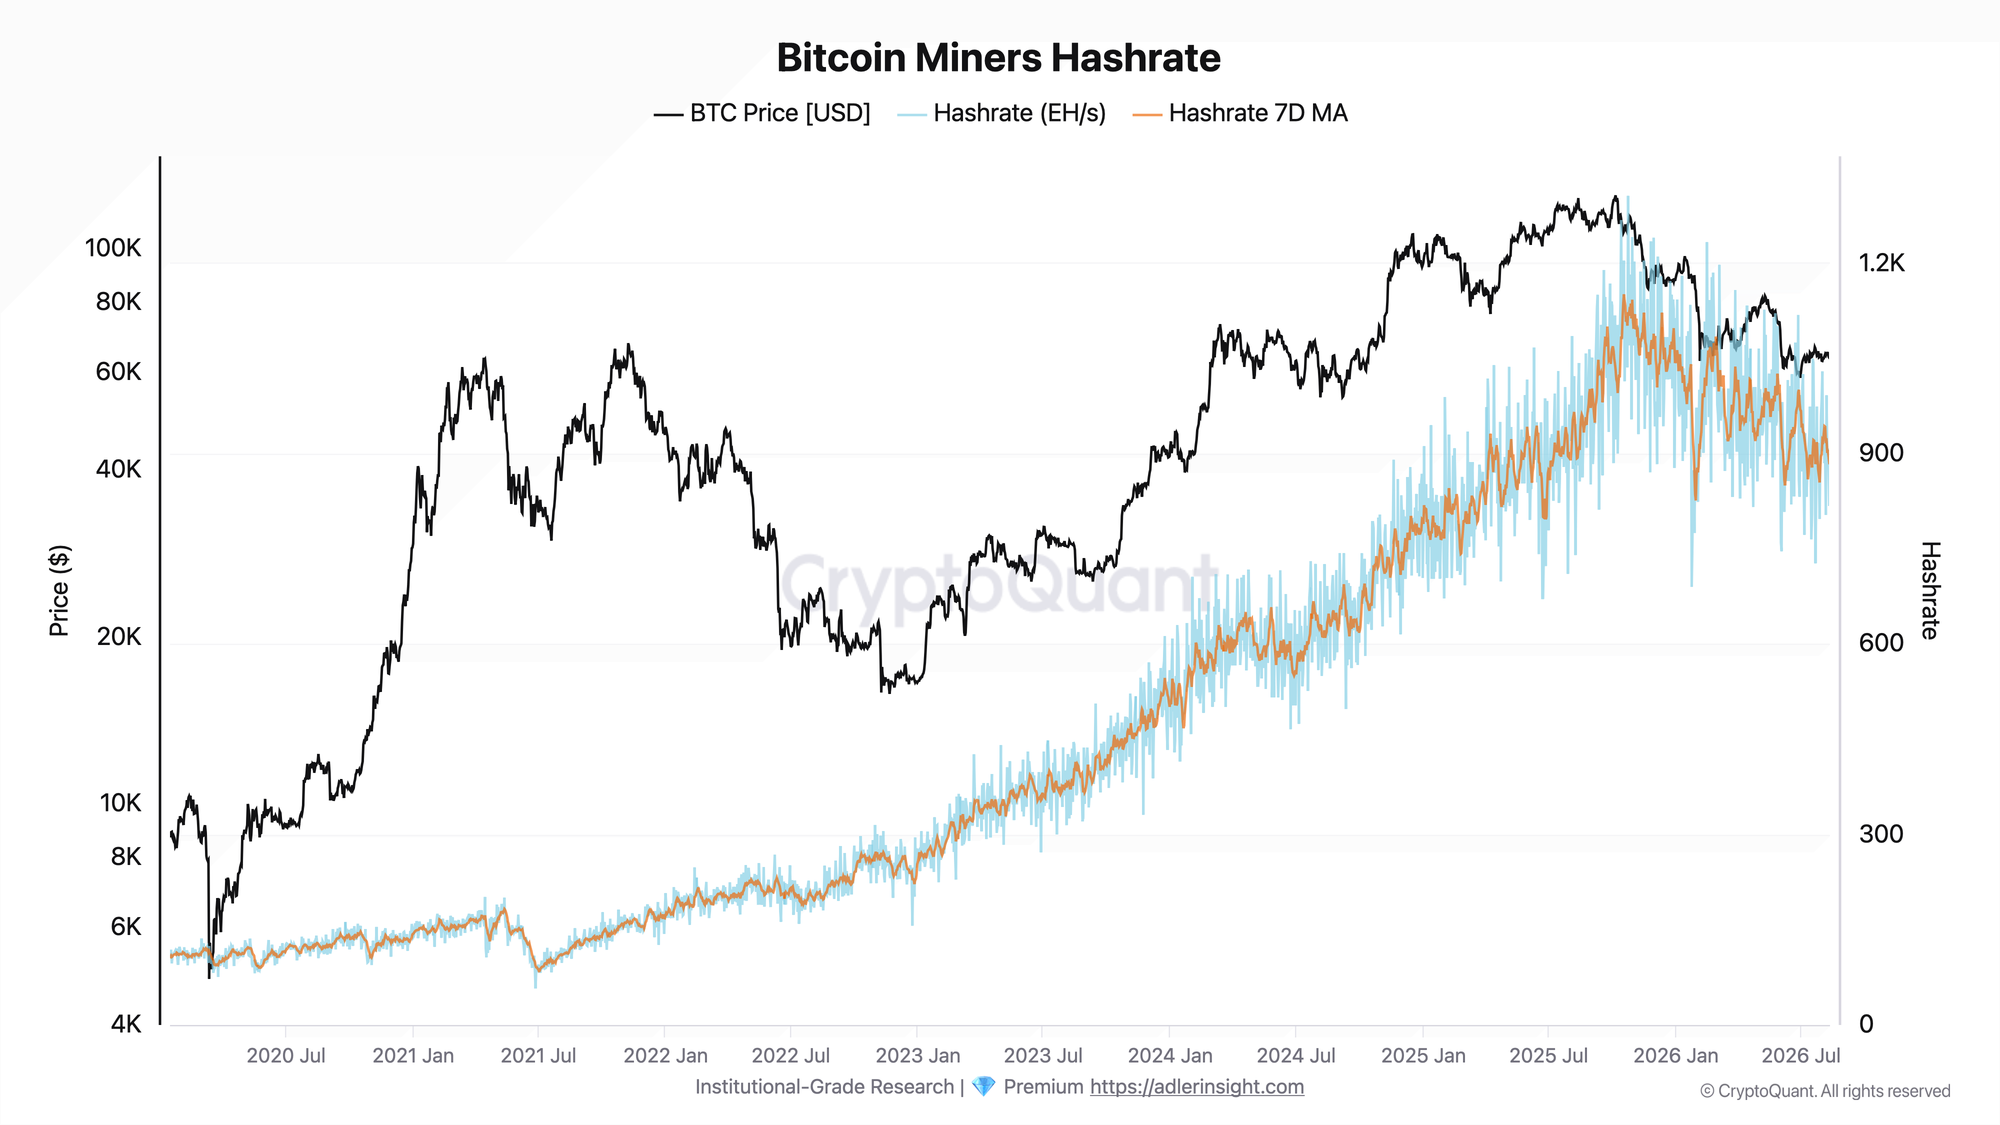
The metric tracks the total computing power of the Bitcoin network in EH/s. The 7D MA hashrate peaked at around 1,150 EH/s on October 18, 2025. As of August 12, 2026, it stands at 886 EH/s, down 23% from the peak.
In recent weeks, hashrate has mostly fluctuated around 900 EH/s. This is not yet a full reversal higher, but neither is it an accelerating collapse. After falling from its autumn highs, hashrate entered a slower phase of contraction with intermittent rebounds.
The price trend is especially important in this context. Bitcoin fell from $124.7K in early October 2025 to $63.4K, a decline of 49%. The percentage loss from the peak was more than twice as large for the price as for hashrate.
This shows that mining infrastructure has so far absorbed the deterioration in mining economics better than the price decline alone would suggest. Revenue in dollar terms has fallen, the fee share is minimal, and the least efficient mining operations have less room to remain viable. Yet the network is responding with a gradual decline in hashrate rather than a sharp shutdown of computing power.
Both charts tell the same story. Mining economics are under pressure from two sides: Bitcoin trades at roughly half its October peak, while fees account for less than 1% of revenue. Despite this, hashrate is down only 23% and remains near 900 EH/s.
This does not mean the pressure is over. The current data show the mining sector adapting to lower profitability rather than capitulating.
The market is forming a bottom, but the best entry only comes after confirmation. Weekly Engine highlights early triggers, key levels, and scenario invalidation conditions. Try it free for 7 days.
FAQ
What does a fee share below 1% mean?
Fees account for less than 1% of total miner revenue. This points to weak fee pressure and low competition among users for blockspace.
Why does a return to 2015 levels not mean the 2015 market is repeating?
Because Bitcoin's economics have changed. In December 2015, the block subsidy was 25 BTC. Today, it is 3.125 BTC. The similarity is in fees as a share of revenue, not in absolute demand or mining profitability.
CONCLUSIONS
Miners are operating under much tougher conditions: Bitcoin is 49% below its October peak, while fees account for only 0.71% of revenue. Yet hashrate is down only 23%.
The similarity with 2015 is not the main takeaway. The historical parallel shows only how small a role fees play in miner revenue. Hashrate provides the more important signal: despite the sharp price decline and weak fee market, the network's computing power is falling much more slowly.
For now, this looks like a controlled adjustment by the mining sector rather than capitulation. A regime change would require two confirmations: Fee Revenue Share holding above 1% and hashrate turning higher. A further acceleration in the decline in computing power would instead signal that pressure on miners is entering a more severe phase.
Live Charts
Explore the metrics behind this brief with live, auto-updating charts:
Puell Multiple - Miner revenue stress and expansion relative to the 365-day average.
Realized Price - Aggregate on-chain cost basis compared with BTC price and long-term trend.
CVDD - Cumulative Value Days Destroyed as a deep-value floor and historical accumulation band.
MVRV Ratio - Market value vs realized value to identify valuation regimes and cycle risk.
Reserve Risk - Long-term holder conviction relative to price to gauge risk/reward at cycle extremes.