
Coin Days Destroyed measures the economic weight of Bitcoin transactions by accounting for how long coins remained dormant before moving. Liveliness transforms this into a cumulative ratio that reveals whether long-term holders are accumulating or distributing-making these metrics essential for identifying major cycle turning points.
Unlike simple volume metrics that treat all transactions equally, CDD and Liveliness give more weight to older coins, providing direct insight into "smart money" behavior. When decade-old Bitcoin suddenly moves, these metrics capture that signal while filtering out the noise of daily trading activity.
TL;DR
- What it measures: CDD quantifies the "age-weighted volume" of Bitcoin transactions; Liveliness tracks cumulative HODLing vs spending behavior
- Key thresholds: CDD spikes >20M coin-days signal major distribution; Liveliness rising = distribution, falling = accumulation
- Best use case: Identifying cycle tops (distribution) and bottoms (accumulation) through long-term holder behavior
- Main limitation: Single whale movements can create false signals; requires moving averages for smoothing
- Combine with: MVRV Ratio, NUPL, Exchange Flows, HODL Waves
Table of Contents
- What Is Coin Days Destroyed?
- What Is Liveliness?
- How CDD Is Calculated
- How Liveliness Is Calculated
- How to Interpret CDD Values
- How to Interpret Liveliness Values
- Historical Cycle Examples
- Practical Application
- CDD vs Dormancy vs HODL Waves
- How CDD Relates to Other Indicators
- Limitations
- FAQ
What Is Coin Days Destroyed?
Coin Days Destroyed (CDD) is an on-chain metric that measures Bitcoin transaction volume weighted by the age of coins being moved. First proposed by a bitcointalk.org user named ByteCoin in 2011, it solves a fundamental problem with raw transaction volume: not all Bitcoin movements carry equal economic significance.
Consider two transactions: a day-trader moving 10 BTC they bought yesterday, versus a 2013 miner moving 10 BTC they've held for 11 years. Raw volume counts both as "10 BTC moved." CDD recognizes that the second transaction carries far more market significance-it represents a long-term holder finally deciding to act.
In one line: CDD multiplies the amount of Bitcoin moved by the number of days those coins remained dormant, measuring the destruction of accumulated "holding time."
Formula
CDD = Σ (BTC amount × Days since last movement)
Where:
- BTC amount = The quantity of Bitcoin in each spent UTXO
- Days since last movement = Time elapsed since that UTXO was created (i.e., last received)
- Σ = Sum across all spent outputs in a given period (typically daily)
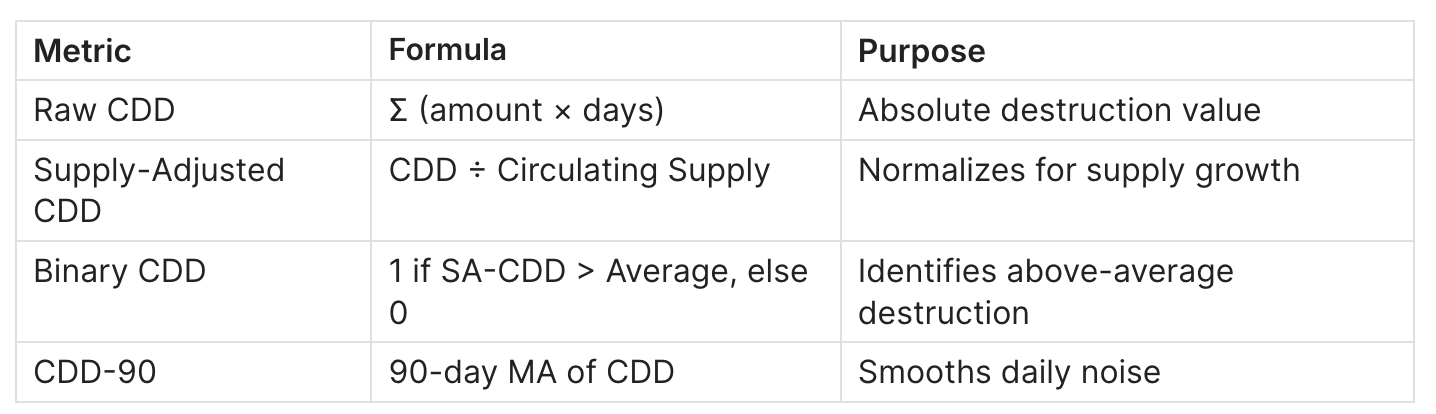
Variations
Data Sources
CryptoQuant | Free/Paid Real-time charts, alerts
Glassnode | Paid Advanced derivatives, exports
Bitcoin Magazine Pro | Free Quick visualization
Newhedge | Free Simple charts
What Is Liveliness?
Liveliness is a cumulative on-chain metric that tracks the ratio of all coin days ever destroyed to all coin days ever created. Developed by Tamas Blummer in December 2018, it provides a macro view of whether the Bitcoin network is in an accumulation phase (holders are HODLing) or a distribution phase (holders are spending).
While CDD shows daily "bursts" of old coin movement, Liveliness smooths this into a trend. Think of CDD as measuring individual waves, while Liveliness measures whether the tide is coming in or going out.
In one line: Liveliness is the cumulative ratio of coin days destroyed to coin days created, revealing the network's overall HODLing versus spending tendency.
Formula
Liveliness = Σ(all CDD from genesis) ÷ Σ(all Coin Days Created from genesis)
Where:
- Σ(all CDD) = Cumulative sum of all coin days ever destroyed
- Coin Days Created = Each day, every existing BTC generates 1 coin day
- Range: 0 to 1 (theoretical), practically 0.008–0.027 (entity-adjusted)
Key Properties
- Rising Liveliness: Long-term holders are spending more coin days than are being created → Distribution phase
- Falling Liveliness: Fewer coin days being destroyed than created → Accumulation phase
- Trend matters more than level: The direction of change signals behavioral shifts
Note: Values in this guide reflect entity-adjusted CDD from CryptoQuant, which filters self-transfers between wallets of the same entity. This produces lower absolute readings than raw Liveliness — focus on directional trends, not absolute levels.
How CDD Is Calculated
Step 1: Track UTXO Age
Every Bitcoin exists as an Unspent Transaction Output (UTXO). When you receive BTC, a new UTXO is created with a timestamp. Each day that UTXO remains unspent, it accumulates 1 "coin day" per BTC.
Step 2: Calculate Destruction at Spend
When a UTXO is spent (moved), multiply the BTC amount by the days it was held. This is the "destruction" of those accumulated coin days.
Step 3: Sum Daily Destruction
Aggregate all destructions across the network for each day to get daily CDD.
Example Calculation:
Imagine three transactions occur on a single day:
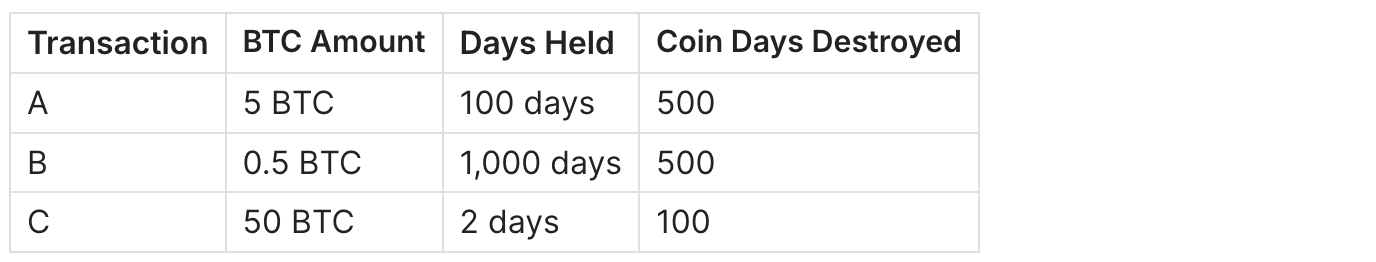
Daily CDD = 500 + 500 + 100 = 1,100 coin days
Notice: Transaction B (only 0.5 BTC) contributes as much as Transaction A (5 BTC) because the coins were held 10× longer. Transaction C, despite being 50 BTC, contributes the least because those coins barely accumulated any age.
Process Visualization
┌─────────────────────────────────────────────────────────────────┐
│  UTXO Created          Holding Period           UTXO Spent      │
│  (Day 0)               (Accumulating)           (Destruction)   │
│                                                                 │
│  5 BTC ──────────────── 100 days ──────────────► 500 CDD        │
│  0.5 BTC ─────────────── 1,000 days ────────────► 500 CDD       │
│  50 BTC ─────────────── 2 days ─────────────────► 100 CDD       │
│                                                                 │
│                                          Daily Total: 1,100 CDD │
└─────────────────────────────────────────────────────────────────┘
How Liveliness Is Calculated
Step 1: Calculate Cumulative CDD
Sum all daily CDD values from Bitcoin's genesis (January 3, 2009) to the current day.
Step 2: Calculate Cumulative Coin Days Created
Each day, the total circulating supply generates new coin days:
- Day 1: 50 BTC × 1 day = 50 coin days created
- Day 2: 100 BTC × 1 day = 100 coin days created (assuming 50 BTC mined)
- And so on...
The cumulative sum is the total "potential" coin days that could ever be destroyed.
Step 3: Compute the Ratio
Divide cumulative CDD by cumulative coin days created.
Example:
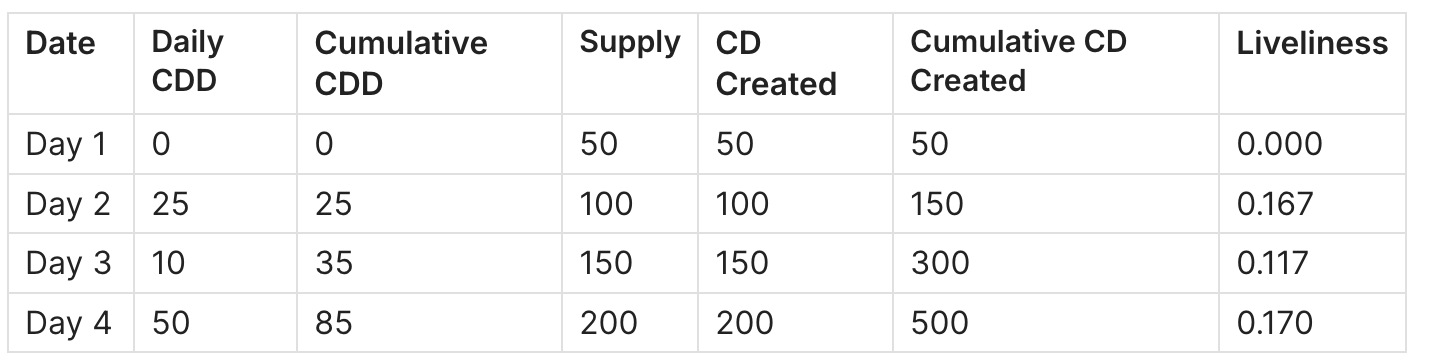
Notice how Liveliness can rise (Day 2, Day 4) when CDD spikes and fall (Day 3) during quiet periods.
How to Interpret CDD Values
Zone Table
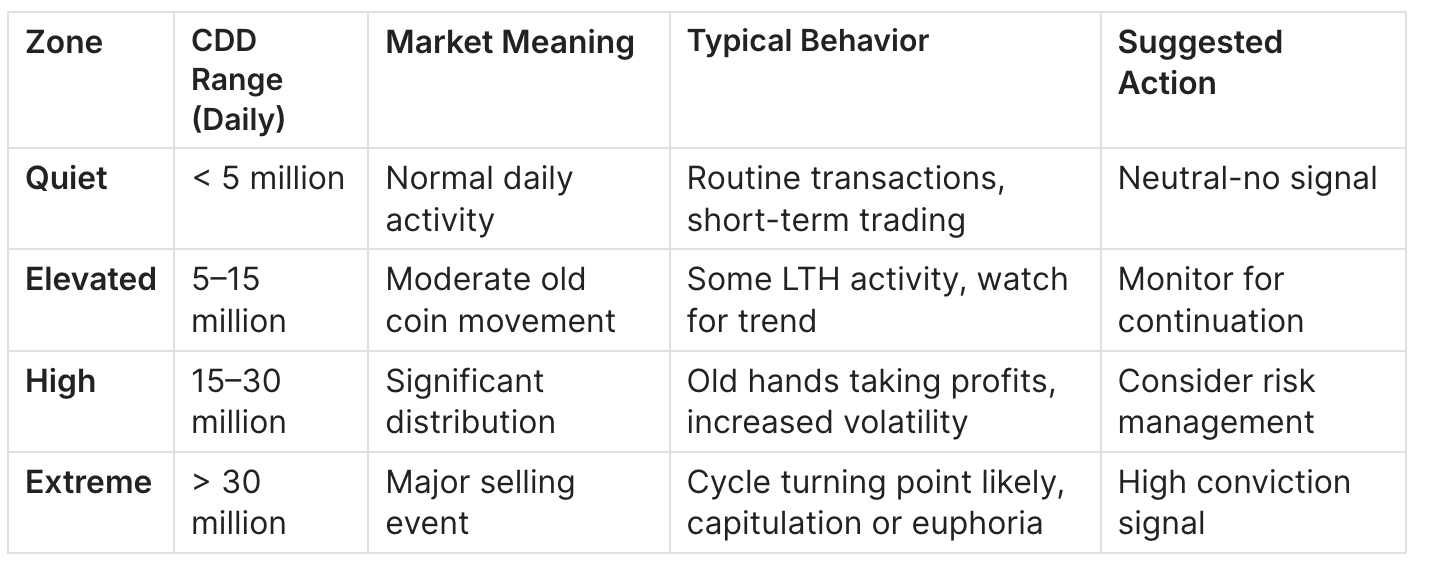
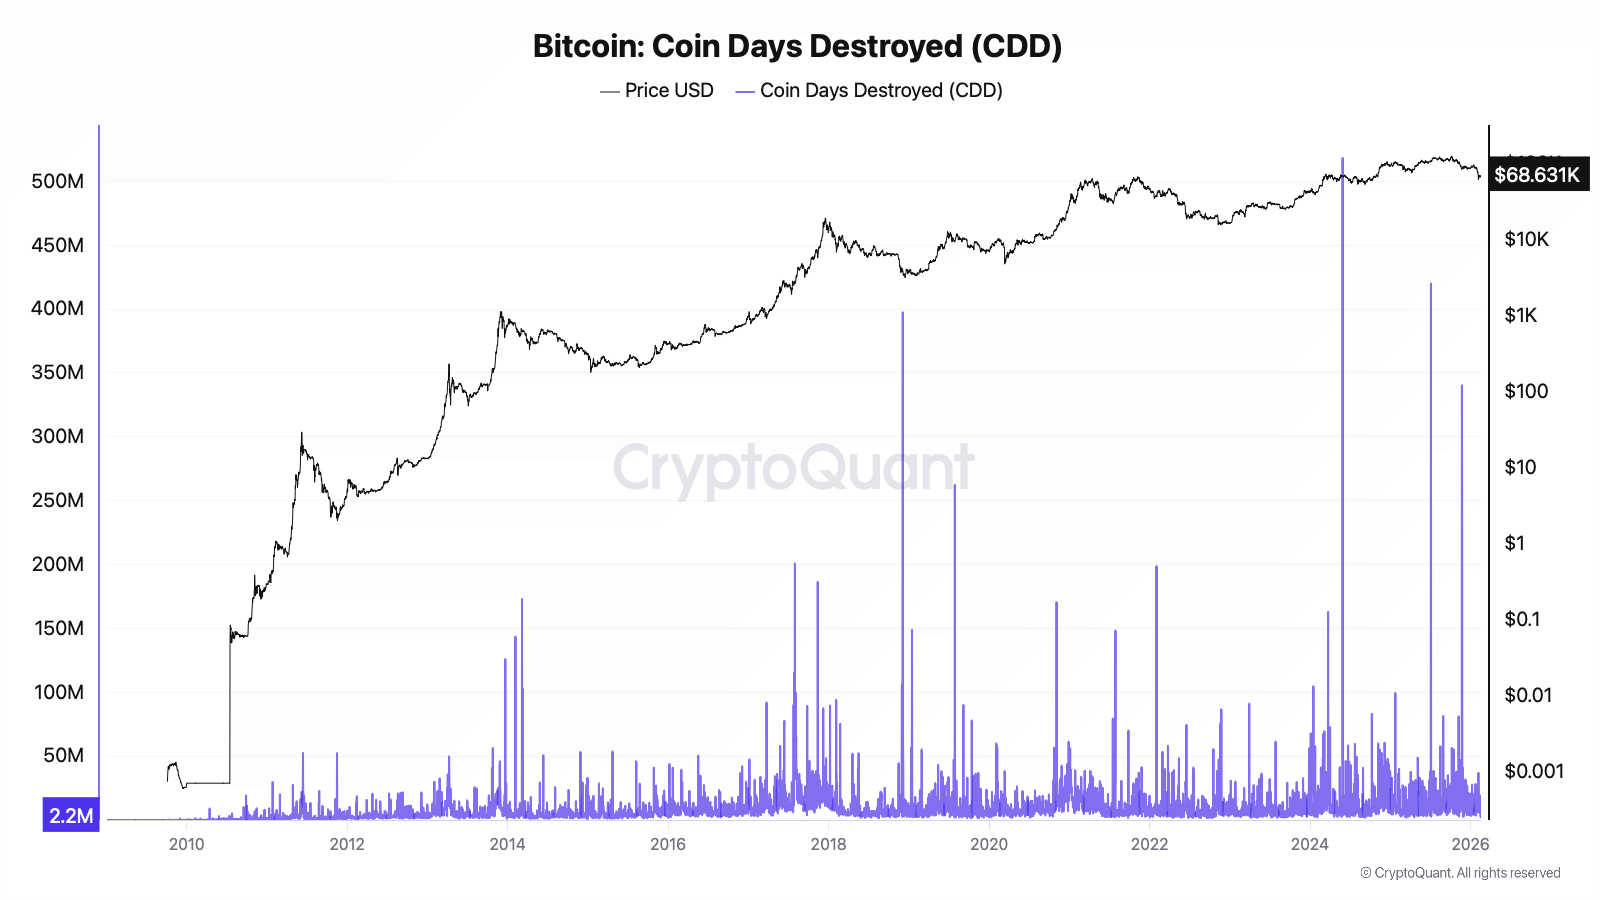
CDD > 20 Million
What it means: Extraordinary amounts of old coins are moving. This typically occurs when:
- Long-term holders sell into strength (cycle tops)
- Panic capitulation during crashes (cycle bottoms)
- Lost coins recovered (Satoshi-era wallets moving)
What you usually see: Sharp price volatility, often coinciding with local or macro extremes. In 2017 and 2021, sustained CDD >20M preceded major corrections.
Typical mistakes: Assuming high CDD always means "top." During capitulation events, CDD can spike as weak hands sell to strong hands-a bullish signal. Context matters: check if price is at highs (distribution) or lows (capitulation).
CDD < 5 Million
What it means: Long-term holders are not selling. Only routine, younger coins are moving.
What you usually see: Price consolidation or slow accumulation. Low CDD during price dips suggests strong hands are holding firm.
Typical mistakes: Interpreting low CDD as "nothing happening." In reality, low CDD during bear markets often signals accumulation-smart money is buying while weak hands sell.
Binary CDD = 1
Binary CDD triggers "1" when Supply-Adjusted CDD exceeds its historical average. A cluster of consecutive "1" readings indicates sustained above-average old coin movement-often seen at cycle peaks.
How to Interpret Liveliness Values
Zone Table
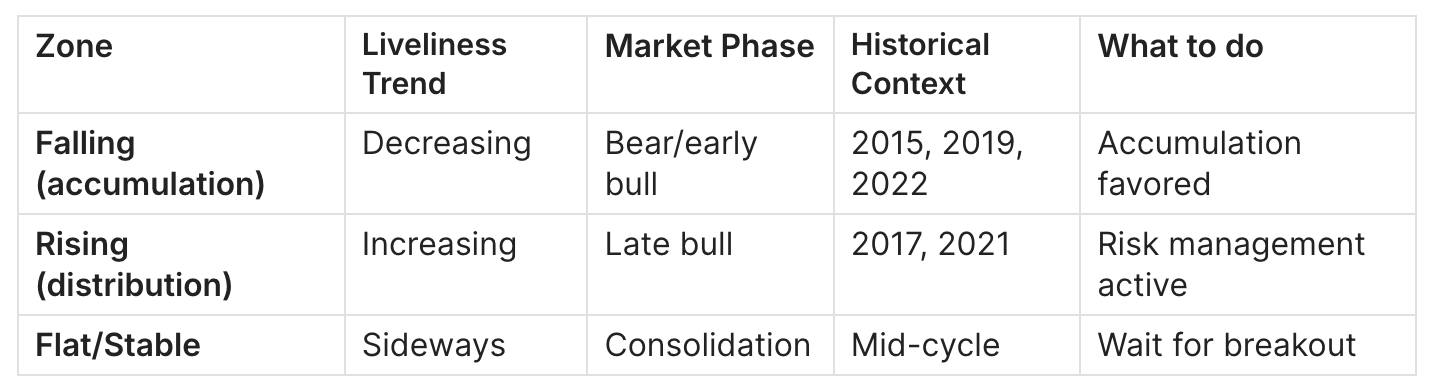
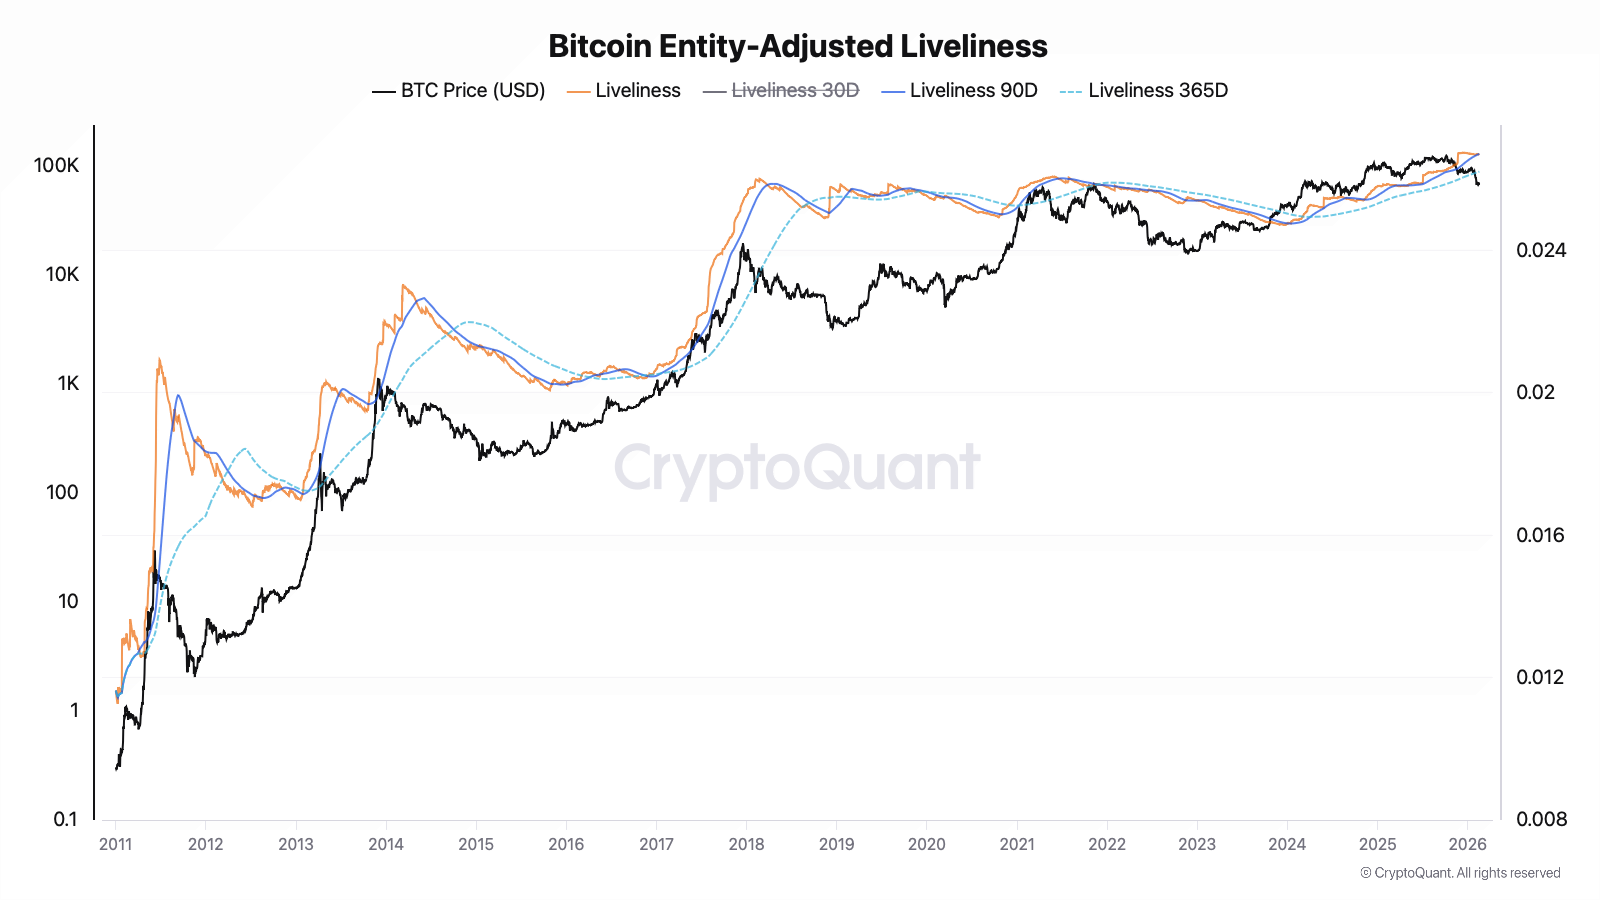
Liveliness Rising
What it means: The rate of coin days destroyed exceeds coin days created. Long-term holders are distributing faster than the network can regenerate holding time.
Historical behavior: Liveliness rose sharply throughout the 2017 bull run, signaling aggressive distribution by early adopters
Caution: A single whale moving coins can spike Liveliness temporarily. Use 30-day moving averages (Liveliness_30d) to filter noise.
Liveliness Falling
What it means: More coin days are being created than destroyed. Holders are increasingly HODLing, absorbing supply without selling.
Historical behavior: After the 2018 crash, Liveliness steadily declined through 2019–2020, reflecting aggressive accumulation during the bear market.
What it suggests: Network is in an accumulation regime. Historically, prolonged falling Liveliness has preceded major bull runs.
Current Reading (February 2026)
Entity-Adjusted Liveliness sits at 0.0267, with the 30D average (0.02670) now converging with the 90D (0.02672) and running above the 365D (0.02622). The metric has been in a gradual uptrend since mid-2024, consistent with long-term holders slowly increasing distribution into cycle strength.
Historical Cycle Examples
Example 1: December 2017 - The $20K Blow-Off Top
Situation: Bitcoin rallied from $1,000 to nearly $20,000 throughout 2017. By December, euphoria peaked.
CDD Behavior:
- Dec 7: 87.4M coin days destroyed (extreme spike)
- Dec 12: 42.3M CDD
- Dec 17 (ATH day): 42.1M CDD
- Dec 20: 48.3M CDD
Liveliness Behavior: Liveliness surged sharply through Q4 2017, reaching a cycle peak on December 17 — the highest reading of the cycle
Price Behavior: Bitcoin peaked at $19,783 on December 17, then crashed 65% over the following weeks.
Conclusion:
- Extreme CDD cluster (multiple days >40M) signaled aggressive LTH distribution
- Liveliness spiking 3× in two months confirmed macro distribution phase
- These metrics provided warning 2-3 weeks before the worst of the crash
Example 2: December 2018 - Capitulation Bottom
Situation: After a year-long bear market, Bitcoin dropped from $6,000 to $3,100. Sentiment was at historic lows.
CDD Behavior:
- Dec 3–4: Daily CDD spiked to extreme levels, briefly pushing Liveliness above its short-term averages before rapidly normalizing
- Following days: Rapid normalization to pre-spike levels
- Liveliness Behavior: The December spikes created brief Liveliness jumps, but the 30-day average remained subdued, confirming the overall accumulation trend.
Price Behavior: Bitcoin bottomed at $3,122 on December 15, 2018, then began its 2019 recovery.
Conclusion:
- Extreme CDD at price lows = capitulation, not distribution
- Spikes followed by rapid CDD decline = supply exhaustion
- Context matters: high CDD at lows is bullish; high CDD at highs is bearish
Example 3: April 2021 - First Peak of Double-Top Cycle
Situation: Bitcoin surged post-COVID, reaching $64,000. Coinbase IPO created additional euphoria.
Liveliness Readings:
- April 6: Liveliness = 0.02598 (30D avg: 0.02594)
- April 14 (local ATH): Liveliness = 0.02600 (30D avg: 0.02596)
- April 30: Liveliness = 0.02605 — cycle peak for the period
Liveliness Behavior: Liveliness rose from 0.02578 in early February to 0.02605 by late April — a modest but sustained increase signaling gradual distribution by long-term holders
Price Behavior: Bitcoin peaked at $64,863 on April 14, crashed to $29,000 by July.
Conclusion:
- Moderate (not extreme) CDD/Liveliness rises still signaled distribution
- The double-top structure required monitoring both peaks
- November 2021 showed similar patterns before the final $69K top
Example 4: January 2024 - ETF Approval Regime Change
Situation: After years of applications, spot Bitcoin ETFs were finally approved on January 10, 2024.
Liveliness Readings:
- Jan 4: Liveliness = 0.02479 (pre-approval baseline)
- Jan 16: Liveliness = 0.02482 (post-approval, modest uptick)
- Jan 31: Liveliness = 0.02488 — monthly peak
Liveliness Behavior: The 30-day Liveliness average rose from 0.02474 to 0.02481 during January — a narrow but consistent uptrend confirming gradual distribution into ETF-driven demand
Price Behavior: Bitcoin rallied from $42K to $49K around ETF approval, then corrected to $38K before resuming the bull run to new ATHs.
Conclusion:
- ETF approval created unique dynamics: old holders distributing to new ETF demand
- Elevated CDD didn't cause sustained downturn due to structural demand shift
- Demonstrates importance of combining CDD with demand-side metrics (ETF flows)
Practical Application
Accumulation / Buy Conditions
Signal: Liveliness falling or flat + CDD consistently <5M for 30+ days
Confirmation conditions:
- MVRV < 1.0 (market below realized value) - see MVRV Guide
- NUPL < 0 (network in aggregate loss) - see NUPL Guide
- Exchange reserves declining - see Exchange Netflow
Common traps:
- Catching falling knives: Low CDD doesn't mean bottom is in; wait for MVRV/NUPL confirmation
- Confusing quiet markets with accumulation: Ensure price is in a downtrend or consolidation, not late-stage euphoria
Risk guidance: Accumulation signals favor DCA strategies over aggressive lump-sum entries. Use zone confirmations rather than timing exact bottoms.
Risk-Off / Distribution Conditions
Signal: Liveliness rising + CDD spikes >20M multiple times in 30 days
Confirmation conditions:
- MVRV > 3.0 (extreme overvaluation) - see MVRV Guide
- NUPL > 0.75 (extreme greed) - see NUPL Guide
- Exchange inflows rising - see Exchange Netflow
- Binary CDD = 1 sustained for 2+ weeks
Common traps:
- Premature exits: Single CDD spikes ≠ cycle top; require clusters
- Ignoring demand: 2024 showed strong demand can absorb distribution
Risk guidance: Distribution signals favor trimming exposure or hedging rather than full exits. Cycle tops are processes, not events-scale out rather than timing exact peak.
Neutral / Wait Conditions
Signal: Liveliness stable + CDD between 5–15M
What to do:
- No directional bias from CDD/Liveliness
- Rely on complementary metrics (NVT, Funding Rates, Exchange Flows)
- Avoid overtrading during unclear signals
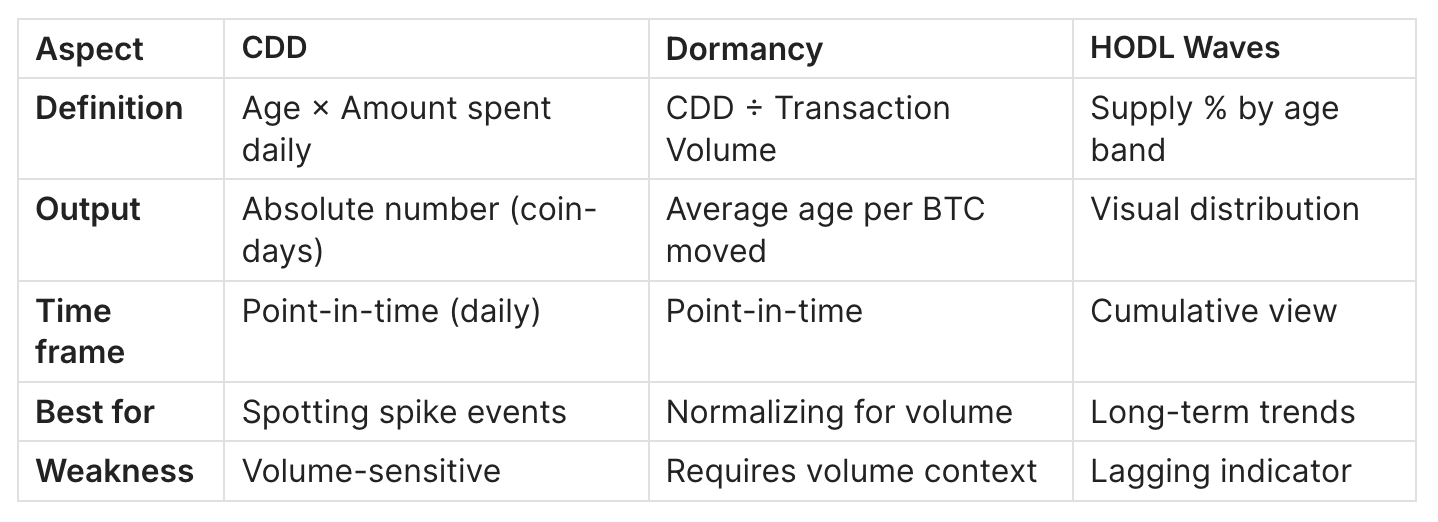
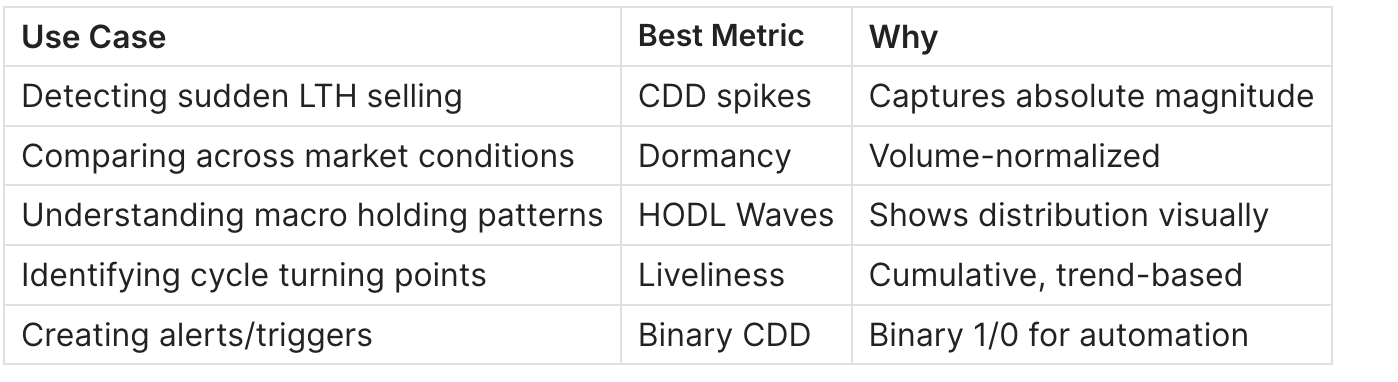
CDD vs Dormancy vs HODL Waves
Three metrics track coin age behavior, each with distinct purposes:
When to Use Which
Combined Analysis Recipe
Recipe 1: Cycle Top Detection
- Check Liveliness trend (rising for 60+ days?)
- Look for CDD clusters >20M
- Confirm with HODL Waves: short-term bands expanding?
- Validate with MVRV >3.0
Recipe 2: Accumulation Confirmation
- Liveliness flat or declining
- CDD <5M sustained
- HODL Waves: 1Y+ bands expanding - relates to LTH vs STH dynamics
- MVRV <1.5, ideally <1.0
How CDD Relates to Other Indicators
Mathematical Bridges
CDD → Liveliness:
Liveliness = Σ(CDD from genesis) / Σ(Coin Days Created from genesis)
CDD → Dormancy:
Dormancy = CDD / Transaction Volume
Dormancy normalizes CDD by volume, showing average age per BTC moved.
CDD → CVDD (Cumulative Value Days Destroyed):
CVDD = Σ(CDD × Price at destruction) / Market Age / 6,000,000
CVDD translates CDD into a price floor model.
Dormancy → Dormancy Flow:
Dormancy Flow = Market Cap / (Dormancy × 365)
David Puell's metric for identifying cycle bottoms (values <250,000 historically = buy zone).
Internal Links
For complementary analysis:
- Bitcoin MVRV Ratio: Definition, Formula & Cycle Signals - Valuation context
- Bitcoin NUPL (Net Unrealized Profit/Loss): What It Is and How to Use It - Profit/loss sentiment
- Bitcoin Exchange Netflow: What It Is and How to Use It - Demand/supply dynamics
Limitations
1. Single Entity Noise
When it fails: A single whale moving ancient coins (e.g., Mt. Gox trustee distributions, Satoshi-era wallets) can spike CDD without broader market significance.
Why: CDD is purely mechanical-it doesn't distinguish between one entity moving 1,000 old BTC and 1,000 entities each moving 1 old BTC.
Solution: Use 7-day or 30-day moving averages. Require sustained elevated CDD rather than single spikes. Cross-reference with exchange inflow data.
2. Internal Transfers
When it fails: Large holders rotating coins between self-controlled wallets register as CDD despite no real "distribution."
Why: On-chain data cannot distinguish self-transfers from actual sales.
Solution: Use entity-adjusted CDD (available on Glassnode) when possible. Combine with exchange flow data-internal transfers don't appear on exchanges.
3. Structural Shifts
When it fails: Bitcoin's evolving market structure (ETFs, wrapped BTC, Lightning Network) changes baseline CDD patterns.
Why: Coins held by ETF custodians rarely move on-chain; Lightning transactions don't register CDD; wrapped BTC on other chains reduces on-chain activity.
Solution: Adjust expectations for "normal" CDD levels. Compare current readings to recent history (6–12 months) rather than all-time patterns.
4. Lagging Nature
When it fails: Both CDD and Liveliness confirm trends after they begin, not before.
Why: You can only see destruction after coins move. By the time Liveliness clearly rises, distribution may be well underway.
Solution: Combine with leading indicators: futures funding rates, stablecoin flows, on-chain momentum metrics.
FAQ
What is Coin Days Destroyed?
Coin Days Destroyed is an on-chain metric that multiplies the amount of Bitcoin moved by the number of days those coins were previously dormant. It gives greater weight to transactions involving older coins, helping identify when long-term holders are active.
What is Bitcoin Liveliness?
Liveliness is the cumulative ratio of all coin days ever destroyed to all coin days ever created. It trends higher during distribution phases (when old coins move frequently) and lower during accumulation phases (when holders sit still).
Where can I find CDD data?
CryptoQuant and Glassnode offer real-time CDD charts with free tiers. Bitcoin Magazine Pro provides simple visualization. For raw data exports, Glassnode or BigQuery (direct blockchain queries) are recommended.
What CDD level is considered high?
Daily CDD above 20 million coin days is considered elevated. Readings above 30 million are extreme and historically rare, often occurring at major cycle turning points.
What is Binary CDD?
Binary CDD returns "1" when Supply-Adjusted CDD exceeds its historical average, and "0" otherwise. It simplifies interpretation: sustained "1" readings indicate above-average old coin movement.
Can CDD be used for altcoins?
Technically yes, for UTXO-based altcoins (Litecoin, Bitcoin Cash, etc.). However, most altcoin CDD data is not tracked by major providers. For account-based chains (Ethereum), dormancy concepts exist but measurement differs.
Why does Liveliness matter more than raw CDD?
Raw CDD is noisy-daily values fluctuate wildly. Liveliness smooths this into a cumulative trend, showing the macro direction of holder behavior. Think of CDD as individual waves; Liveliness is the tide.
What's the difference between CDD and Dormancy?
CDD is an absolute measure (total coin days destroyed). Dormancy divides CDD by transaction volume, yielding the average age of coins moved. Dormancy is useful for comparing periods with different activity levels.
How reliable is CDD for predicting tops?
CDD is a confirming indicator, not a predictive one. It identifies distribution in progress but cannot predict exactly when distribution ends. Use with MVRV, NUPL, and price action for timing.
What does low Liveliness mean?
Falling or low Liveliness indicates the network is in accumulation mode: holders are creating more coin days than destroying them. This typically occurs during bear markets and early recovery phases.
How often should I check CDD?
For macro analysis, weekly reviews of 30-day averages suffice. For active trading, daily monitoring with alert thresholds (>20M CDD or Binary CDD = 1) can inform risk management.
Conclusion
- CDD transforms transaction volume into age-weighted insight, elevating the significance of old coin movement over routine trading
- Liveliness provides macro perspective, distilling daily CDD noise into a trend showing accumulation vs distribution
- Historical patterns are consistent: extreme CDD at price highs signals distribution; extreme CDD at price lows signals capitulation
- Context is mandatory: the same CDD spike means opposite things at cycle tops vs bottoms
- Combine with valuation metrics (MVRV, NUPL) and flow metrics (Exchange Flows) for complete analysis
CDD and Liveliness reveal what long-term holders-often the most informed market participants-are actually doing. In a market flooded with noise, this behavioral transparency is invaluable.
Weekly Engine: One action per week (BUY / HOLD / EXIT). Triggers that change it. Invalidation that protects you. 10 minutes/week. No noise. Just the plan. → adlerinsight.com
Adler AM: Free daily morning briefs in your inbox → axeladlerjr.com
Combine With Other On-Chain Metrics
Coin Days Destroyed (CDD) and Liveliness become far more actionable when you confirm them with broader valuation, sentiment, and flow indicators. These three metrics are the most effective companions for cycle analysis.
MVRV Ratio (Valuation Context)
Use MVRV Ratio to determine whether high CDD is happening during a historically overheated market. When MVRV > 3, distribution signals and long-term profit-taking tend to be much more meaningful.
NUPL (Market Sentiment Confirmation)
Pair NUPL with CDD to confirm emotional extremes. A combination of high CDD + extreme NUPL often appears near major cycle tops, where long-term holders are distributing into peak optimism.
Exchange Netflow (Supply and Demand Flows)
Combine CDD with Exchange Netflow to understand whether old coins are moving into exchanges (potential selling) or leaving exchanges (rotation into long-term storage).
- High CDD + exchange inflows often signals distribution pressure.
- High CDD + exchange outflows can signal strategic repositioning or accumulation.