


After the pullback, Bitcoin reclaimed the key short-term holder cost basis, while the technical pricing models chart shows price breaking above two of the three major moving averages on higher volume. Both views confirm a strong recovery in the local market structure, but not a reversal of the broader trend.
TL;DR
Price moved back above the STH cost basis at $68.2K, SMA200, and SMA111, putting short-term holders back in profit. However, the moving-average structure remains bearish, while SMA365 at $83.2K forms the key resistance above. The current regime is constructive, but not fully risk-on.
Bitcoin Cost Basis
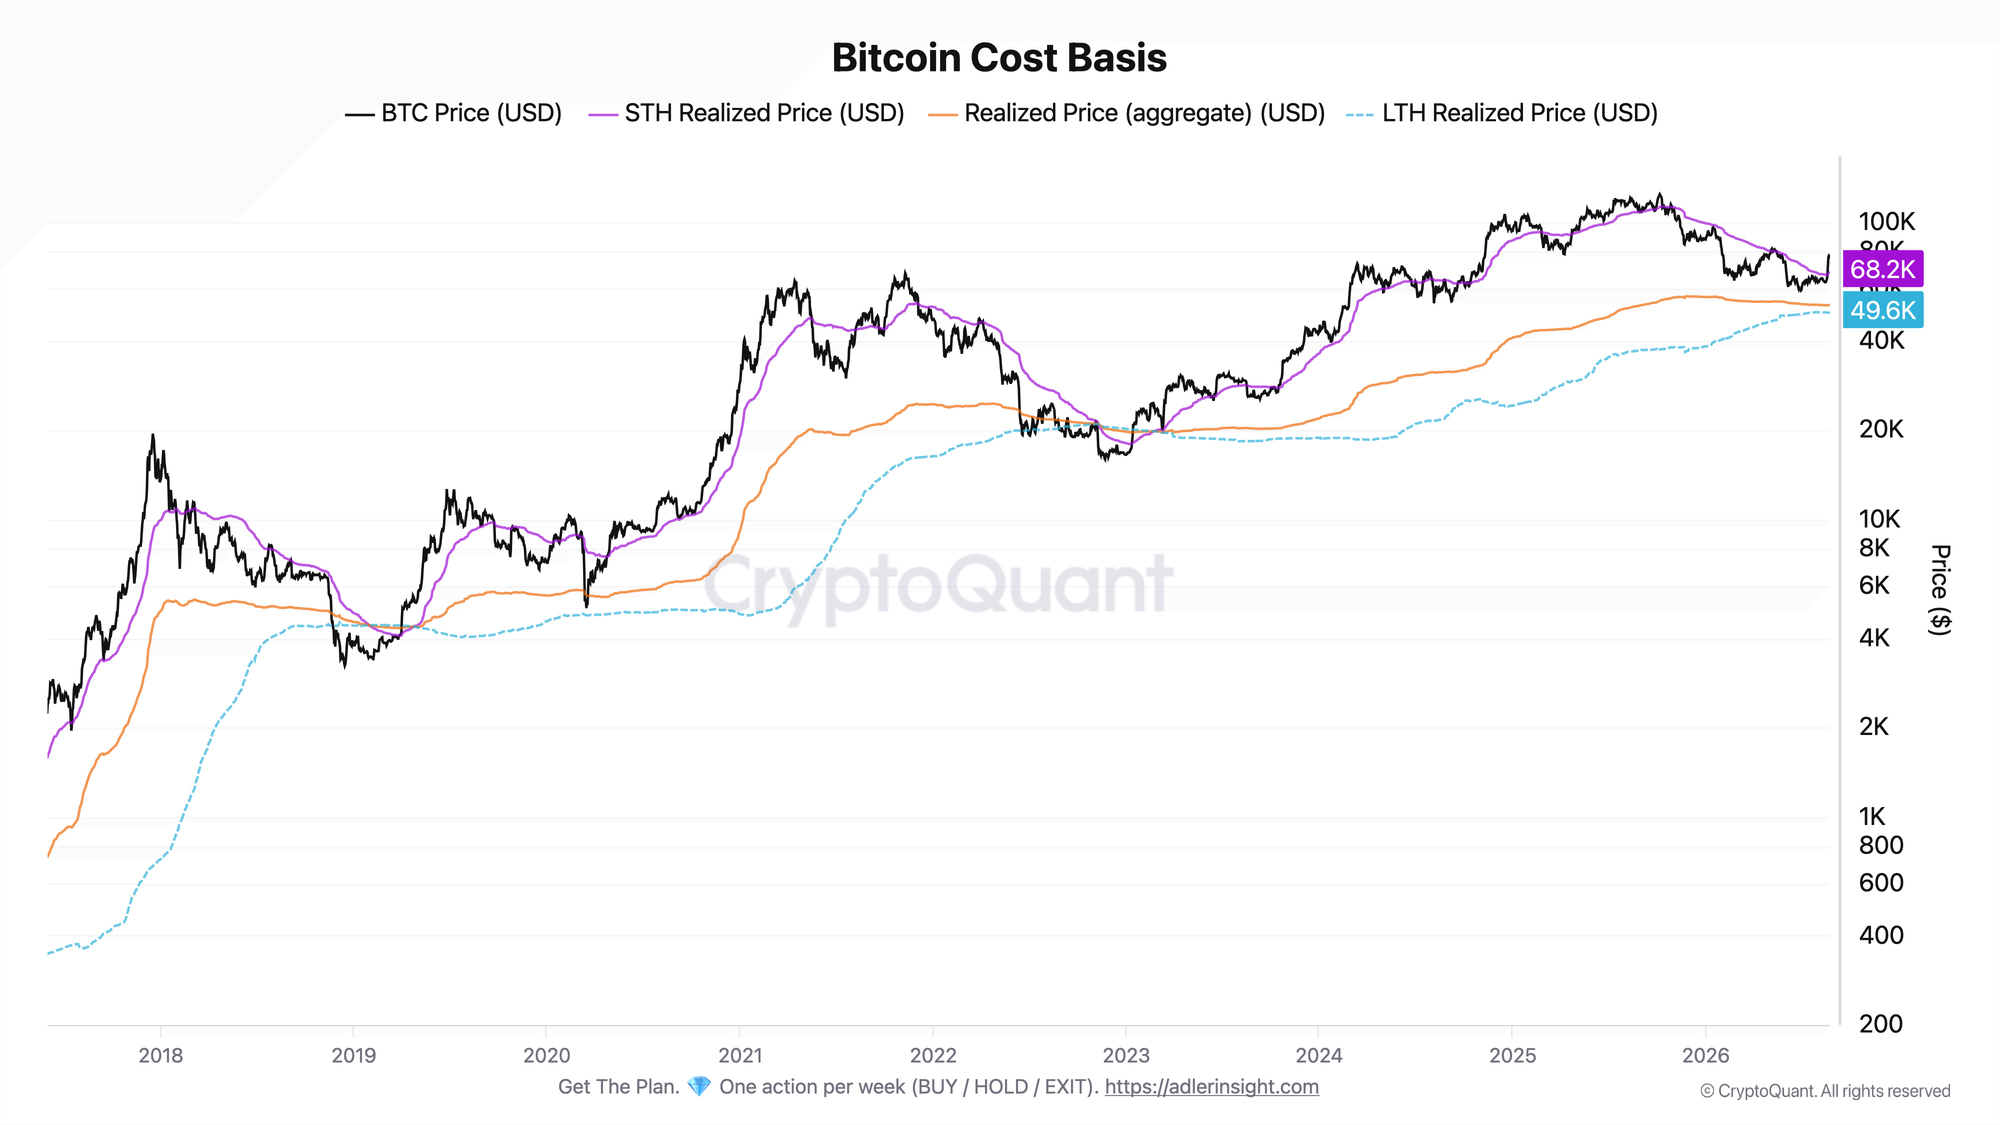
Price returned to $80K and held above the short-term holder cost basis at $68.2K. The rebound from the $59K low is 35%, bringing a significant share of recent buyers back into profit. The aggregate market cost basis at $52.9K and the LTH Realized Price at $49.7K remain well below the current price, meaning these deeper purchase levels were not reached even during the pullback.
Moving back above the STH cost basis reduces pressure from short-term holders sitting at a loss, but increases the risk of profit-taking. The key confirmation is whether the $68K zone holds during subsequent pullbacks. Losing it would put some STHs back at a loss and increase the risk of renewed selling pressure from underwater coins.
Bitcoin: Technical Pricing Models
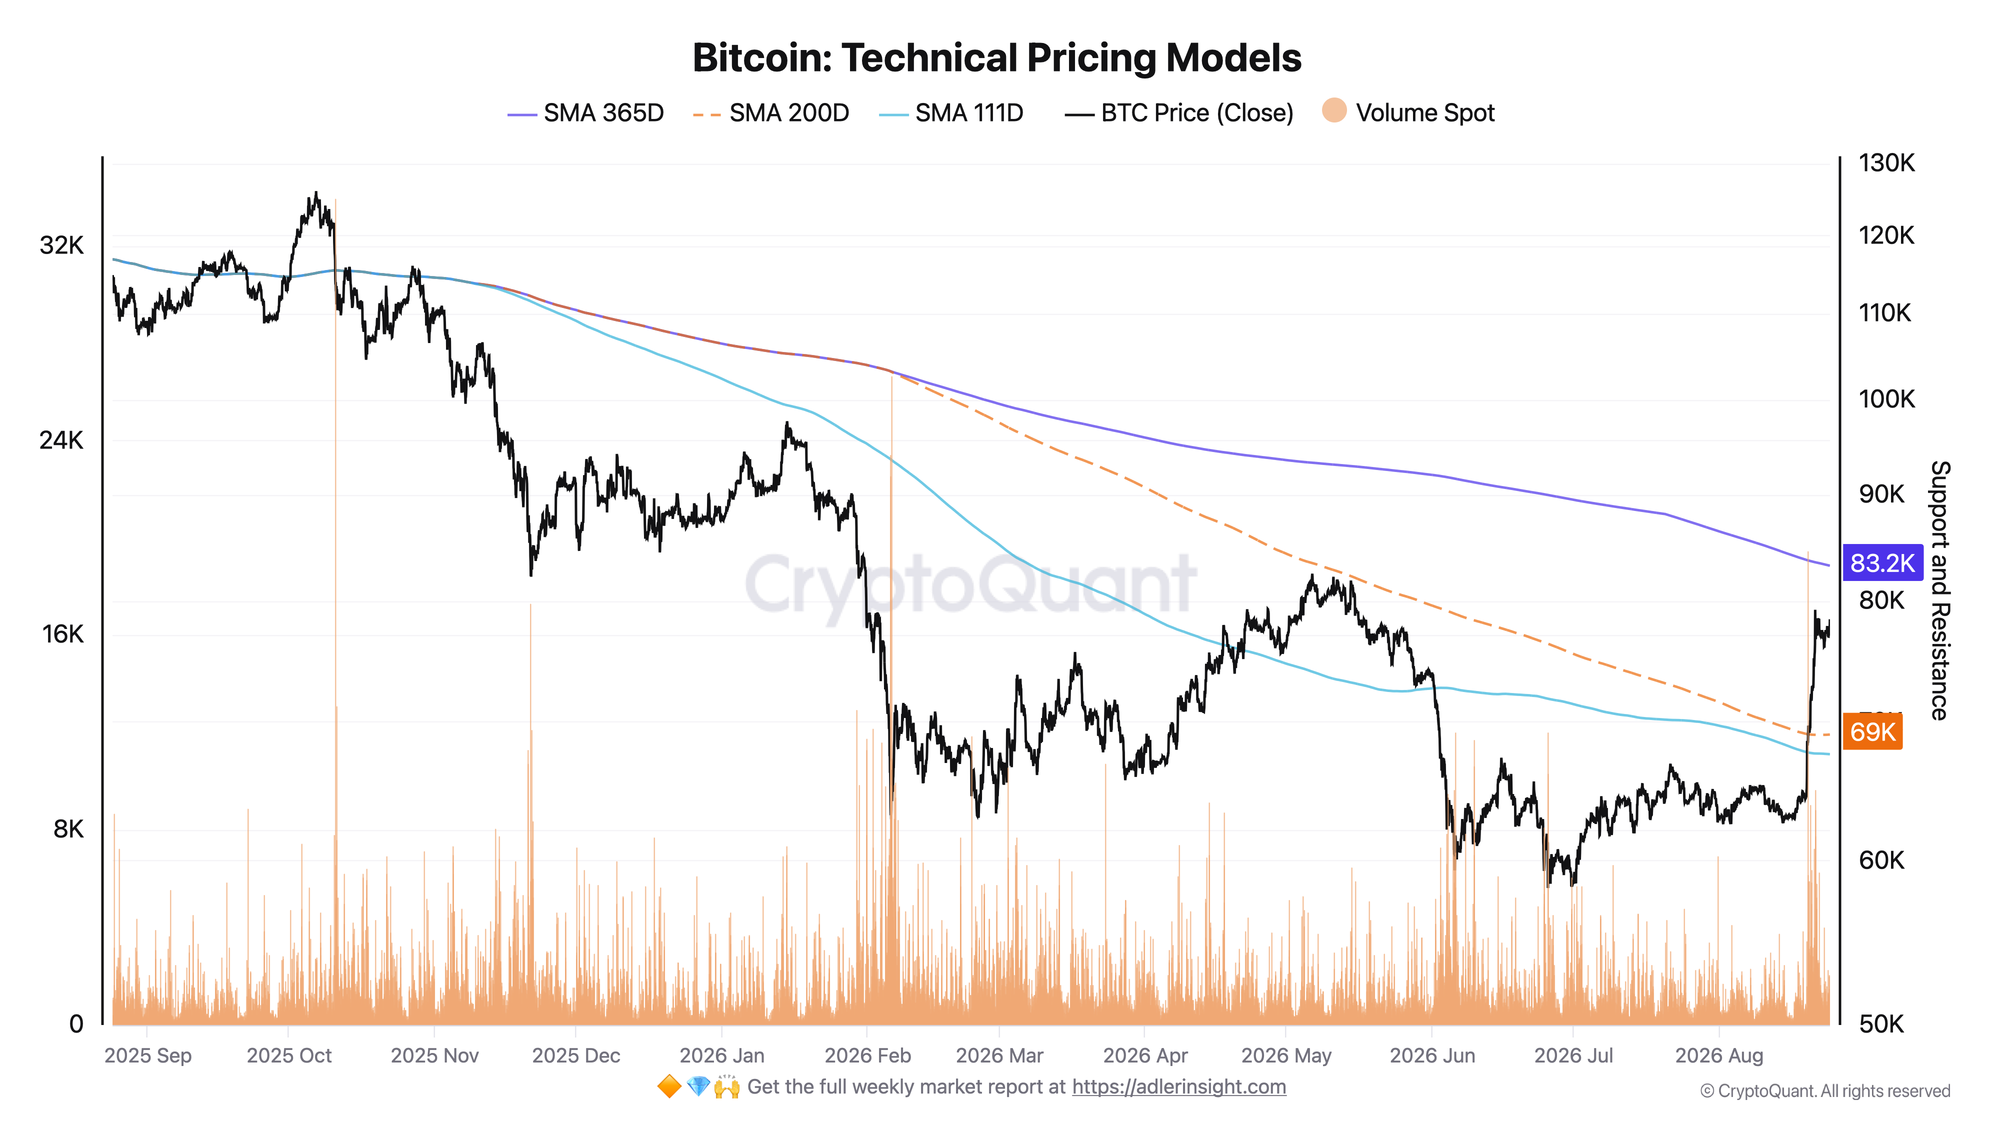
A sharp move on higher volume pushed price above SMA200 at $69K and SMA111 at $67.5K after a prolonged period of trading below them. However, the bearish moving-average stack remains intact: SMA111 is below SMA200, and both are below SMA365 at $83.2K, which now forms the key resistance above. In other words, the local breakout occurred within a broader downward structure that remains intact.
This is a clear improvement in the short-term picture, but the trend reversal is not yet confirmed. The main level above is $83.2K. A rejection from SMA365 would preserve the existing structure, while holding above it would provide the first serious evidence of a regime change.
The link to the first chart is the $67K-$69K zone, which includes both the STH cost basis at $68.2K and the SMA111/SMA200 cluster. This range is now the key area: above it, short-term holders remain in profit and price stays above two key moving averages; below it, both signals begin to deteriorate quickly.
One decision per week. A defined exposure cap. Weekly Engine replaces fear, FOMO, and guesswork with a rules-based Bitcoin strategy you can follow. Start here.
FAQ
What matters more today - the rebound or the bearish moving-average stack? The combination of both signals matters most. Price reclaimed the $67K-$69K zone across both the on-chain STH cost basis and the technical SMA111/SMA200 levels, so the recovery looks stronger than a typical short-term rebound. However, the bearish moving-average stack shows that the broader trend has not yet confirmed a reversal.
What level separates continued recovery from another decline? The key zone below remains $68K-$69K: holding it keeps STHs in profit and price above SMA111/SMA200, while losing it would weaken both signals. The main level above is $83.2K, where SMA365 is located. Holding above it would provide the first serious confirmation of a regime change.
CONCLUSIONS
Both charts describe the same market phase from different angles. Bitcoin reclaimed the short-term holder cost basis at $68.2K and simultaneously broke above SMA111/SMA200 in the $67K-$69K zone, putting recent buyers back in profit after the pullback to $59K.
This shifts the short-term structure into a constructive regime, but a reversal has not yet been confirmed. The moving-average stack remains bearish, while SMA365 near $83.2K forms the key resistance above.
The main confirmation of strength is whether the $68K-$69K zone holds during pullbacks. The main test for continued upside is $83.2K. A rejection from this level followed by a loss of the STH cost-basis zone would weaken the structure again and restore the risk of a downward scenario.
Live Charts
Explore the metrics behind this brief with live, auto-updating charts:
Realized Price - Aggregate on-chain cost basis compared with BTC price and long-term trend.
STH-SOPR - Short-term holder profit/loss behavior around the 1.0 breakeven threshold.
Supply in Profit - Share of circulating supply in profit as a cycle-phase and euphoria gauge.
NUPL - Net unrealized profit/loss across holders, mapped into cycle sentiment phases.
Holder Behavior - All holder profitability and supply-cohort charts in one view.