


Long-term holders significantly increased their distribution after the short squeeze. At the same time, LTH MVRV rose above its mid-August levels, showing that this increase in activity is occurring while holders retain substantial unrealized profits.
TL;DR
Supply-side activity from long-term holders increased after the short squeeze. High LTH profitability creates conditions for continued profit-taking if price remains stable.
Bitcoin LTH Distribution 30-Day Sum
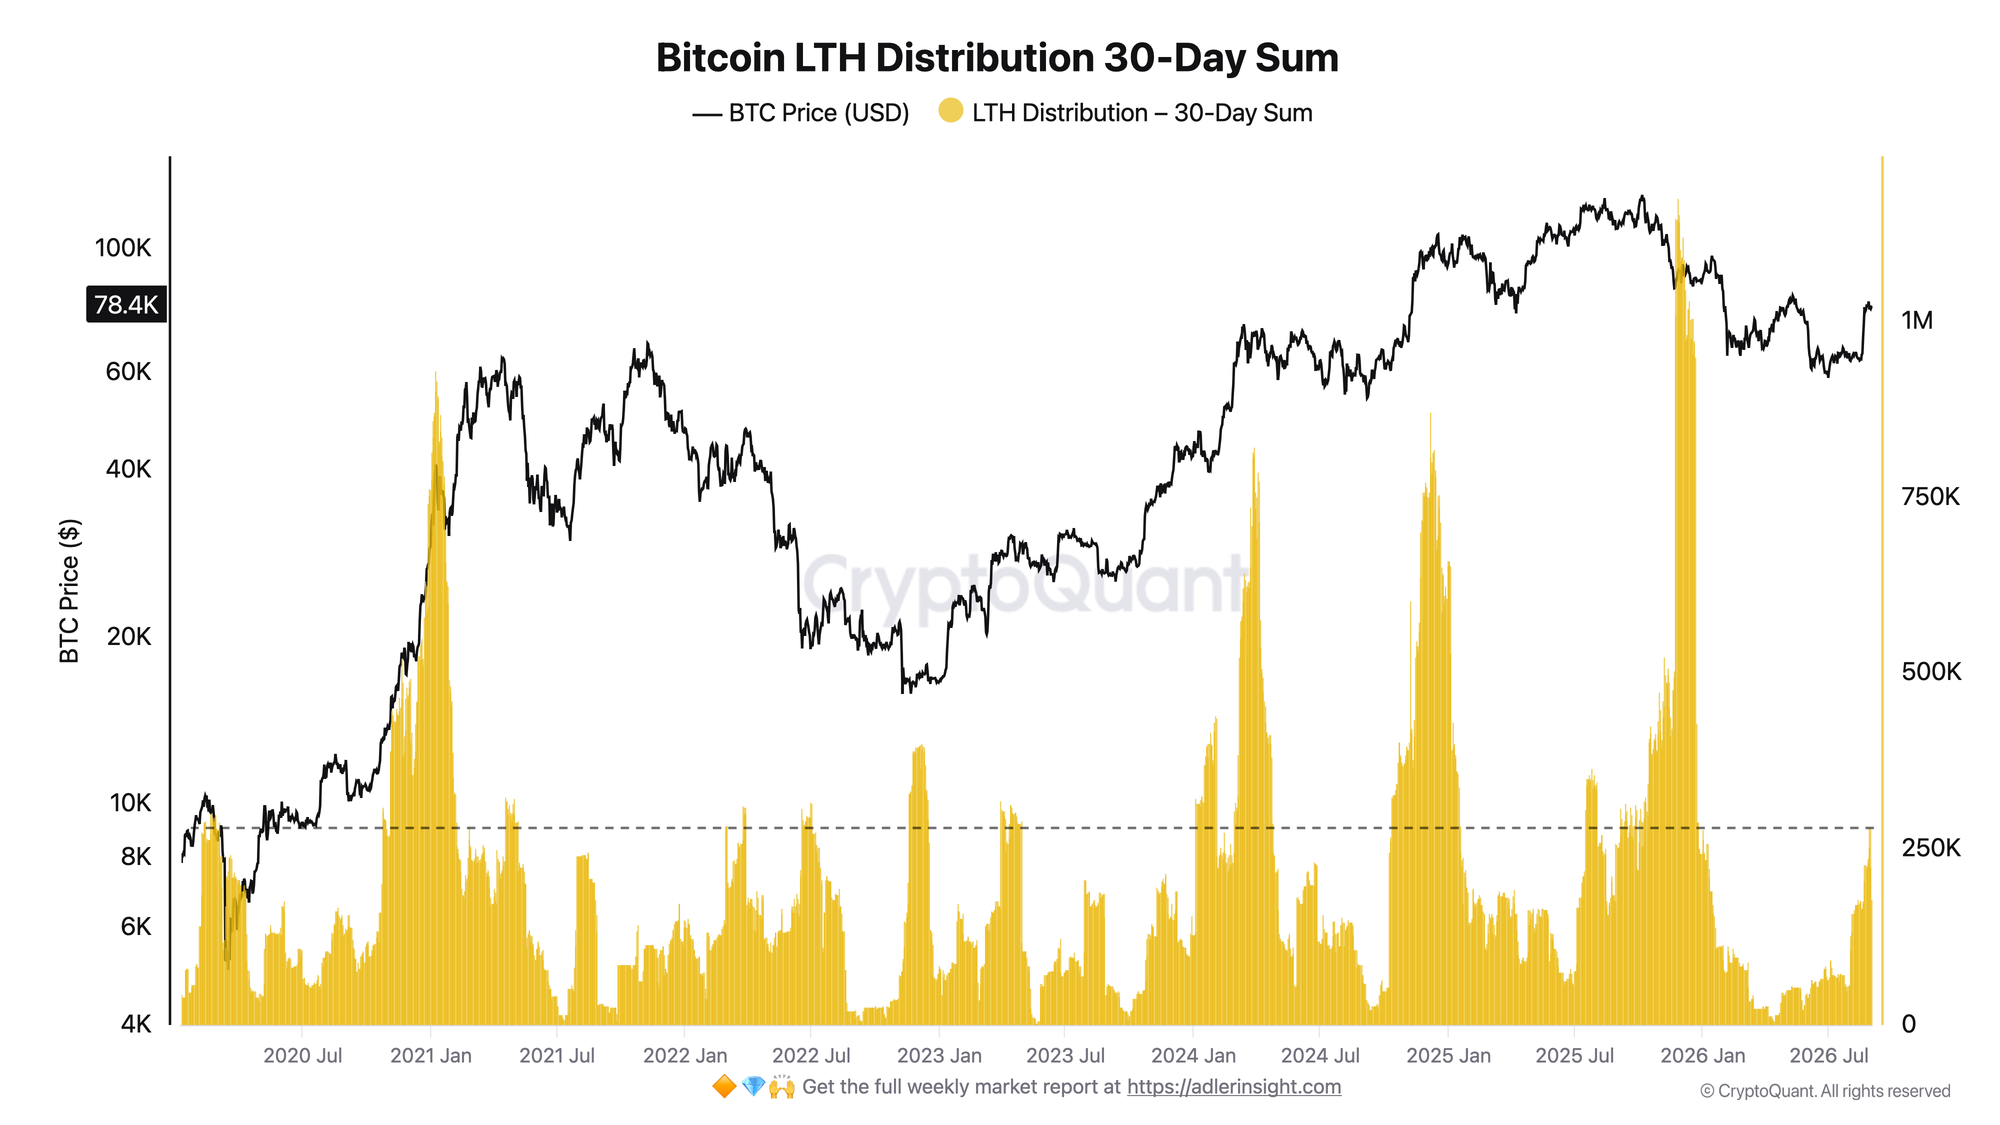
From August 18 to August 28, the 30-day sum of LTH distribution rose from 174.5K to 281.9K BTC, an increase of 61.5%. The August 28 reading was the metric's highest level since the beginning of 2026. The acceleration coincided with Bitcoin's sharp recovery after the short squeeze, when the price increase opened a window for profit-taking.
Bitcoin LTH MVRV
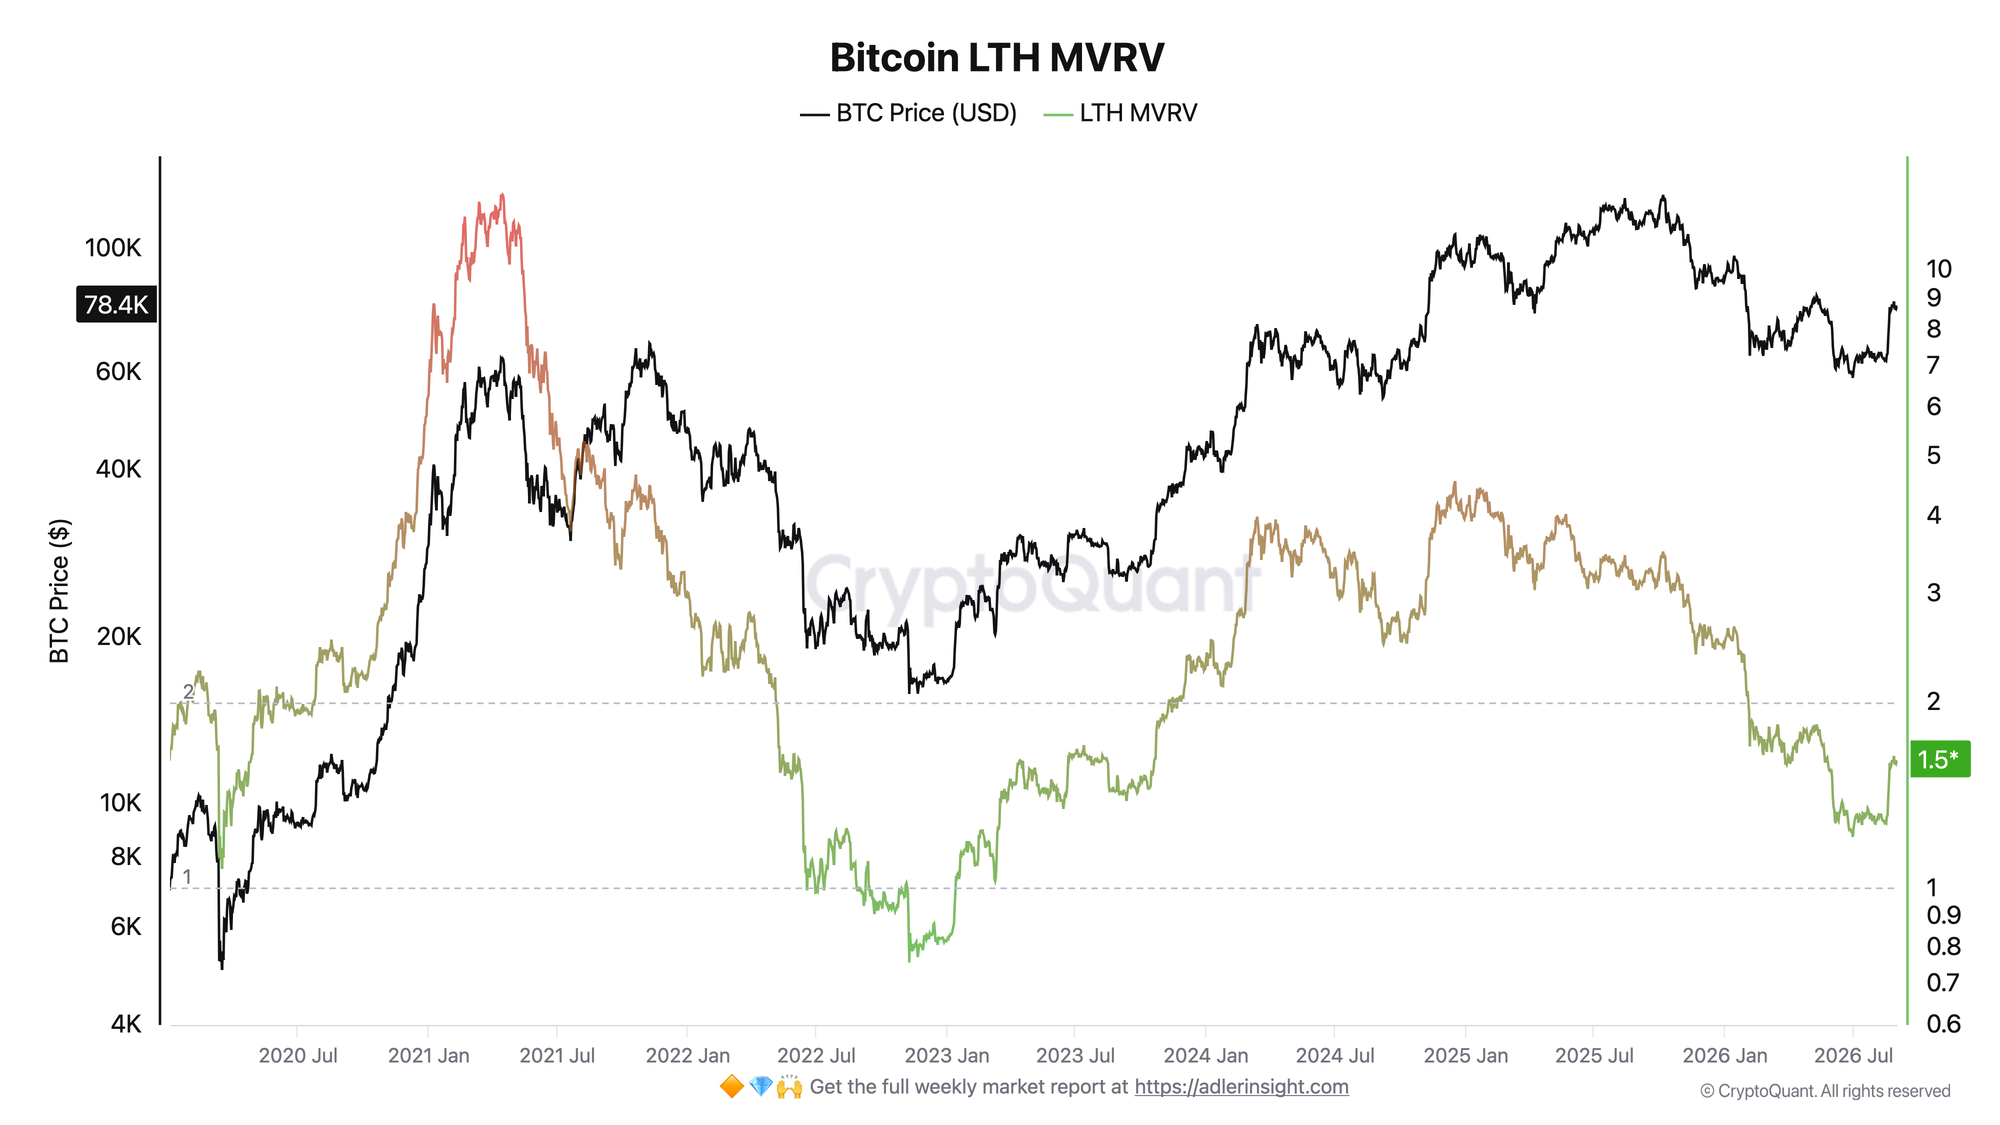
LTH MVRV rose from 1.31 on August 18 to 1.64 on August 27. On August 31, the metric stood at 1.60, meaning the market value of LTH coins was 60% above their average realized value.
The increase in distribution after the sharp recovery gives more experienced holders an additional opportunity to take profits.
The price increase after the short squeeze raised LTH profitability while also coinciding with a sharp increase in their distribution.
Outperform Buy & Hold with a rules-based strategy. One weekly action, clear triggers, and invalidation levels. No guessing. Get access.
FAQ
Why did LTH distribution accelerate after the short squeeze? The sharp price recovery increased unrealized profits among long-term holders and created more favorable conditions for profit-taking.
Why does the increase in LTH MVRV matter when assessing distribution? An LTH MVRV of 1.60 shows that long-term holders retain substantial unrealized profits. This increases the economic incentive to take profits after the sharp price recovery.
CONCLUSIONS
After the short squeeze, the price increase raised LTH profitability while also coinciding with faster distribution. This creates an additional source of supply for the market. The main question today is whether elevated LTH activity will continue and whether new demand can absorb this volume without renewed pressure on price.
Live Charts
Explore the metrics behind this brief with live, auto-updating charts:
MVRV Ratio - Market value vs realized value to identify valuation regimes and cycle risk.
LTH-SOPR - Long-term holder profit/loss realization around the 1.0 breakeven threshold.
LTH vs STH Supply - Supply split between long- and short-term holders to track accumulation and distribution.
NUPL - Net unrealized profit/loss across holders, mapped into cycle sentiment phases.
Exchange Netflow - Net BTC moving to and from exchanges across positive and negative flow regimes.