
🎧 Morning Brief #159 - audio debate on today’s market setup
The liquidations oscillator has turned positive for the first time in two weeks: shorts are once again dominating forced closures. But the SMA(7D) of open interest is declining at the same time. This means the market is not building a new derivatives position - it is closing the old one.
TL;DR
The weekly liquidations signal shows that pressure has shifted onto shorts. However, OI in the seven-day smoothing continues to decline. This is a short squeeze on a compressing leverage base, not an accumulation of a new bullish position.
Bitcoin Futures Long/Short Liquidations Dominance - SMA(7D)
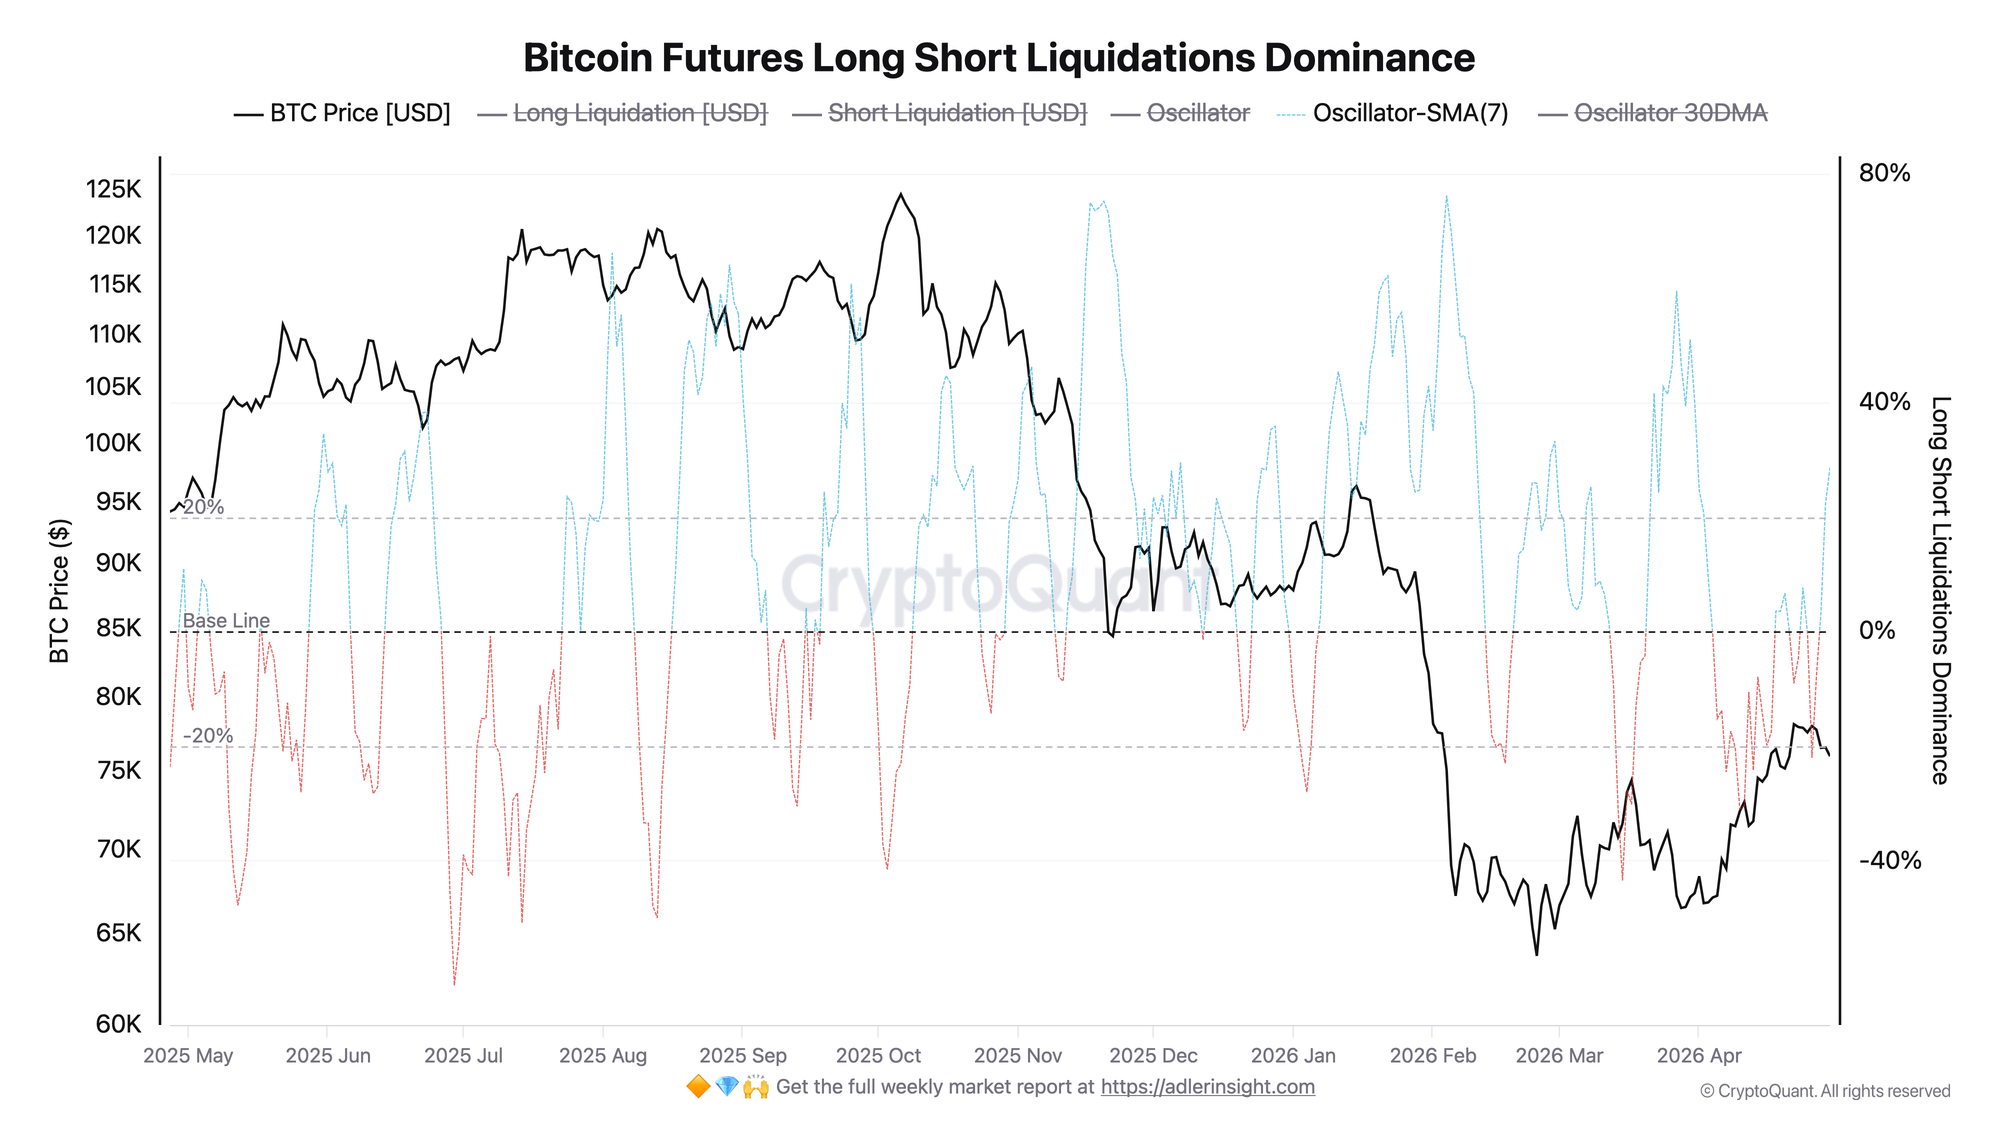
The liquidations dominance oscillator, smoothed over 7 days, completed a distinct cycle over the past two weeks. From April 17 to April 26, the SMA(7D) stayed predominantly in negative territory. The peak of pressure came on April 26, when the indicator dropped to around -22. This meant that long liquidations were dominating in the weekly window.
From April 27, the structure began to shift. On April 28, the SMA(7D) moved into a symbolic positive at +3.3, and by April 30 it had climbed to +28.7 - the highest reading over the observed period. In the seven-day window, shorts are now being forced closed noticeably more actively than longs.
However, the 30-day moving average is still negative, around -3. The current SMA(7D) reversal is therefore a fresh signal. It is already tactically relevant, but has not yet changed the market's structural balance.
A SMA(7D) reversal into sustained positive territory becomes significant only when confirmed by open interest.
Open Interest of Bitcoin Futures - Top Exchanges SMA(7D)
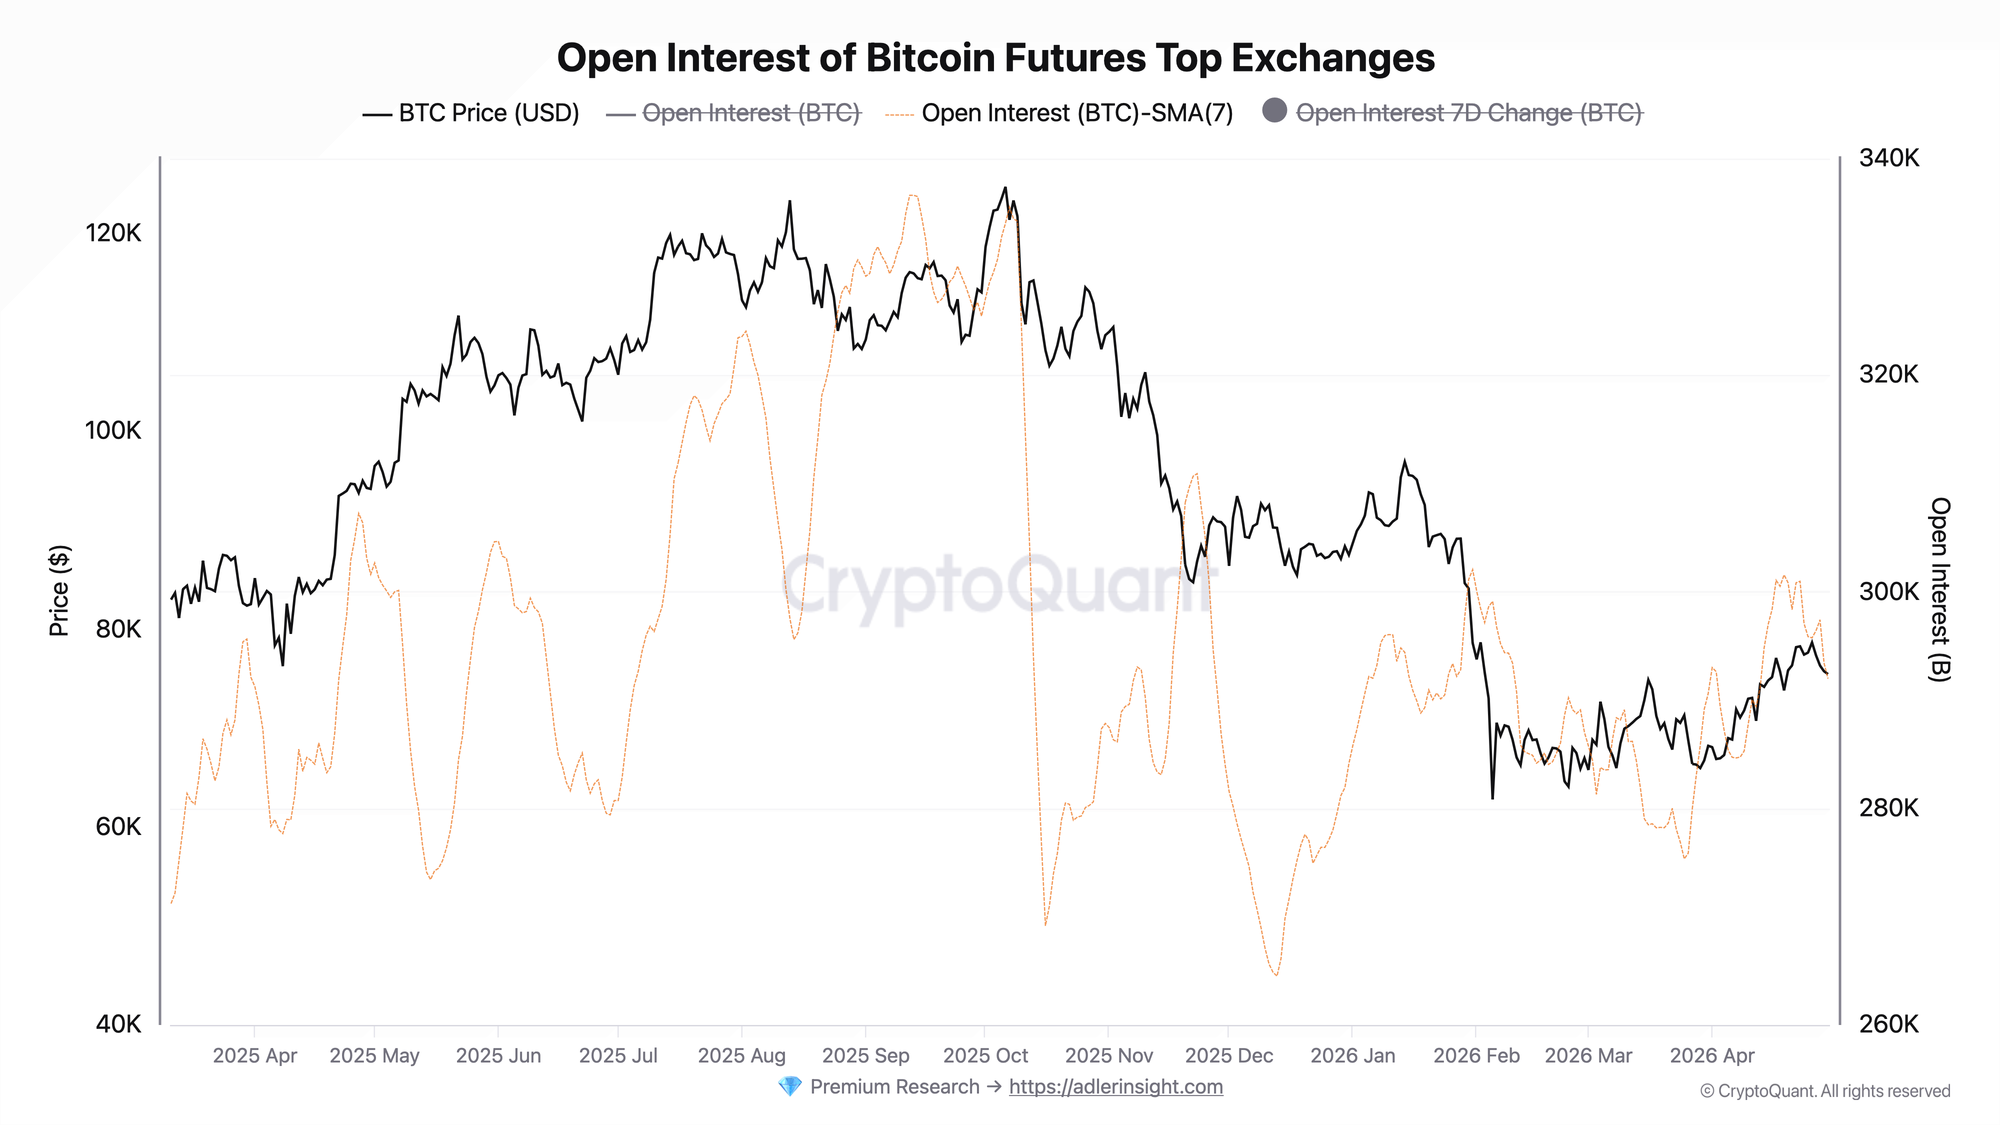
The SMA(7D) of open interest tells the opposite story. From April 17 to April 22, the indicator held above 300K BTC, after which it began to decline. The total SMA(7D) drawdown over the past 10 days amounts to approximately 8-9K BTC. The seven-day OI change also remains negative: around -10K BTC on April 30, and on April 29 the drop came close to -28K BTC.
This is a direct signal that leverage is not being added. The market is losing derivatives volume at precisely the moment when shorts are beginning to dominate liquidations. A new bullish position through futures is not being built yet.
Link: rising short liquidation dominance alongside declining OI means the move is primarily driven by squeeze. Shorts are being flushed out, but no new position is being built. Price is receiving support from the mechanics of forced closures, not from an inflow of new capital through derivatives.
Stop letting Bitcoin volatility make the decisions for you - start your 7-day free trial. Weekly Engine tells you when to hold, when to reduce risk, and when the market regime is breaking down. One clear action per week, built to protect capital before the next drawdown hits.
FAQ
Why does it matter to look at SMA(7D) rather than daily values? Daily oscillator readings are too noisy. On April 26 the indicator was around -77, pointing to long liquidation dominance, and just one day later it had climbed to +31, showing short liquidation dominance. SMA(7D) smooths out this noise and shows the weekly regime: who is systematically under pressure.
Under what condition does the scenario shift to genuine bullish accumulation? If the SMA(7D) of OI reverses upward and begins to grow steadily while short liquidation dominance persists. That would indicate the market is not merely flushing shorts, but building a new long derivatives position. Until then, the current impulse remains technical.
CONCLUSIONS
The seven-day moving averages of both metrics give a clear reading of the current regime. Short liquidation dominance is strengthening: the SMA(7D) oscillator climbed to +28.7 by April 30. But open interest is declining at the same time, with the SMA(7D) dropping from above 300K BTC to approximately 292K BTC.
The key trigger for a shift to a more bullish view is OI turning higher while the liquidations oscillator remains positive, meaning short liquidations continue to dominate.
The key risk: if short liquidation dominance fades before OI begins to grow, the current impulse will remain a technical short squeeze without the support of new leverage.
P.S.
BTC remains trapped below the key $78K-$79K resistance zone: the market failed to hold above the short-term holder cost basis, while short-term holders started taking profits, limiting the rally’s follow-through. The nearest major support zone is $65K-$70K.
Further Reading
- Bitcoin Open Interest & Leverage Ratio
- Bitcoin Open Interest vs Price: 4 Divergence Patterns Every Trader Must Know
- Bitcoin Open Interest and Funding Rate: The Combined Framework for Reading Derivatives Markets
- Bitcoin Liquidation Cascade: How It Works, Why It Happens & How to Predict It
- Bitcoin Funding Rates: Definition, Formula & Cycle Signals