
🎧 Morning Brief #163- audio debate on today’s market setup
Realized Cap Change 30D has just exited a 75-day negative cycle, but crossed zero only formally. HODL Waves show who was selling all this time and why the market still sees no new spot buyer.
TL;DR
Spot capital was contracting for 75 days. Now the indicator has barely moved into positive territory, even as BTC sits at $81K. The main pressure came from STH buyers of the highs, who sold at a loss or near breakeven. New spot demand has not been confirmed yet.
Bitcoin Realized Cap Change 30D (%)
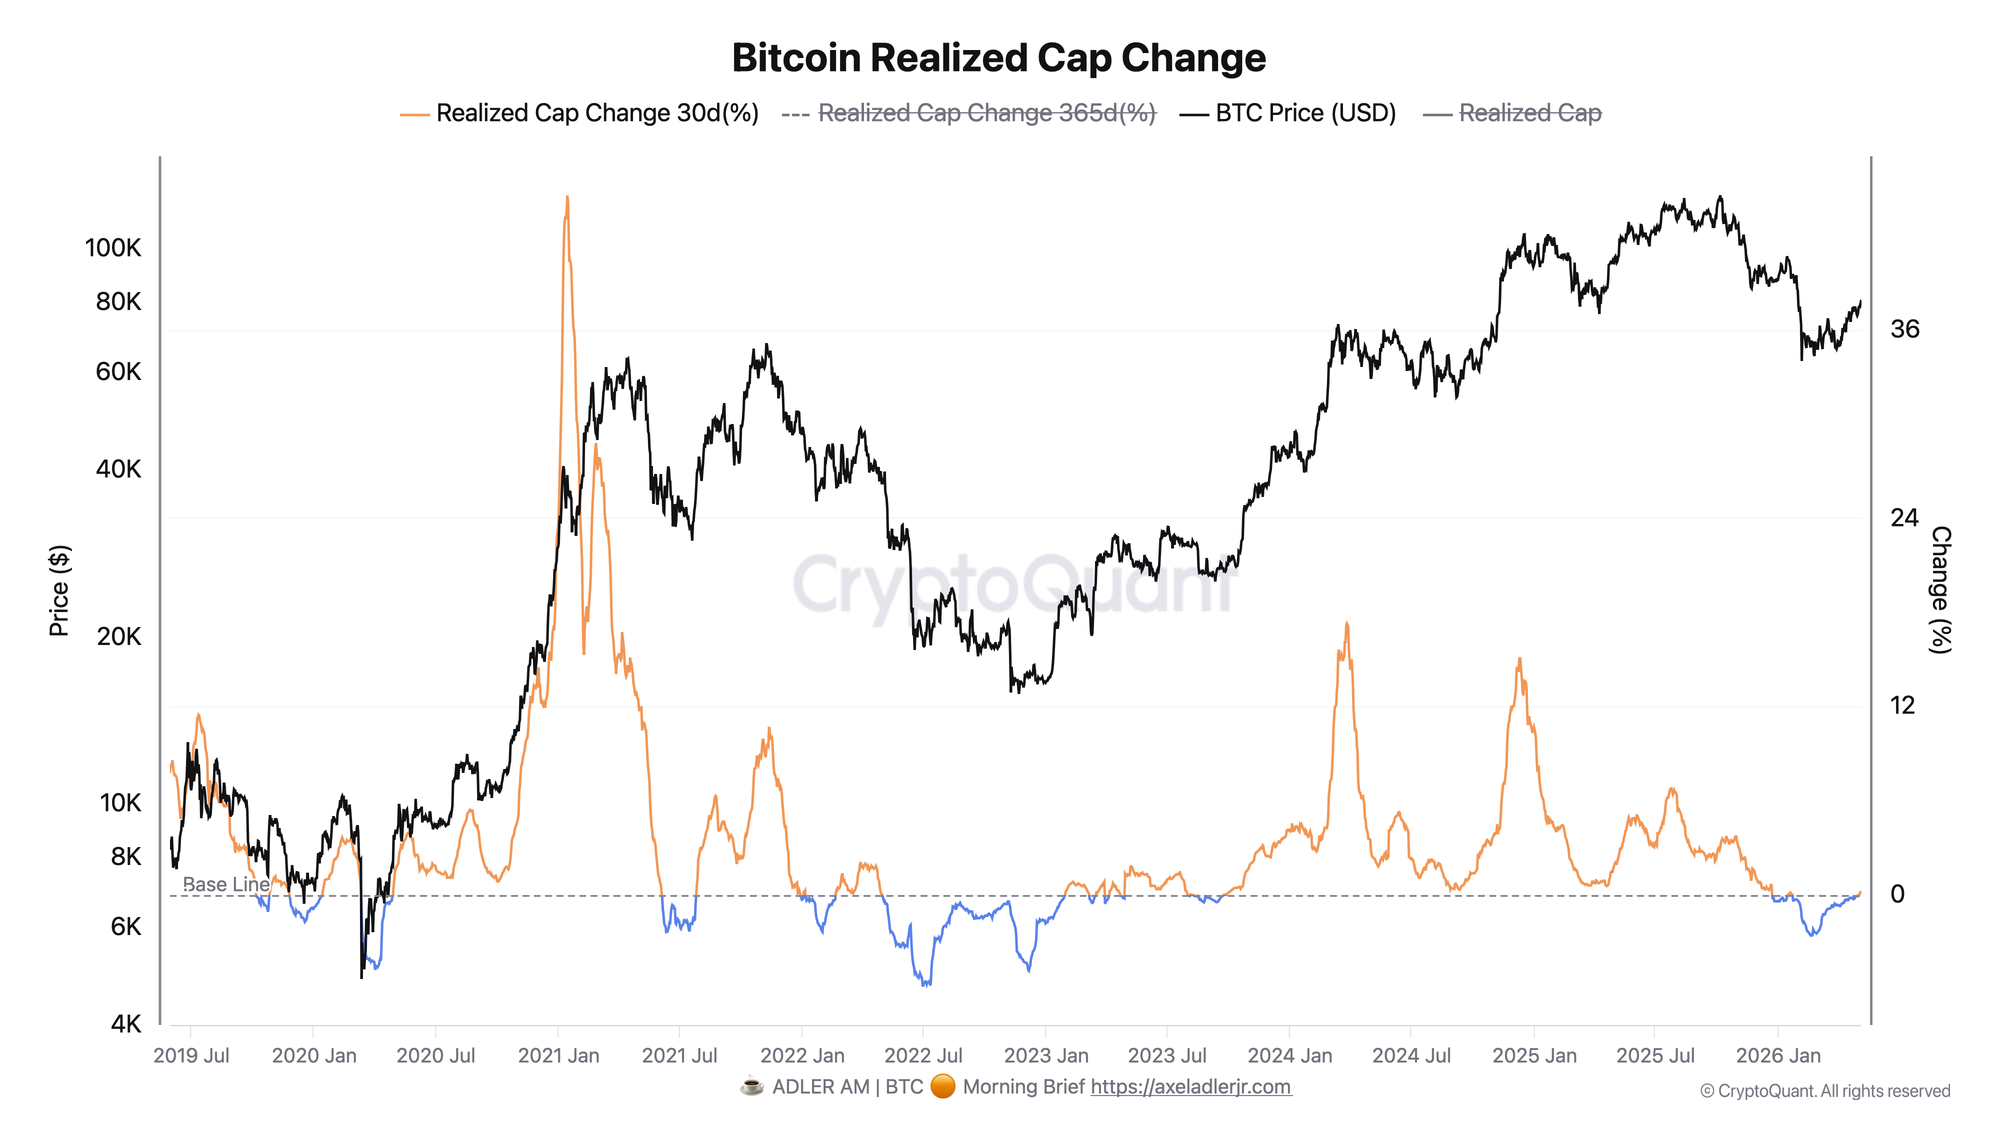
The metric reflects the 30-day change in realized capitalization - a proxy for spot capital inflow and outflow in the network.
Realized Cap Change 30D turned negative in early January 2026 and reached a low of -2.58% on February 20 at a price of $68,000. The indicator remained in negative territory until May 2 - 75 consecutive days of spot capital contraction. Today, May 6, the value is +0.22% at a price of $81,274, with realized capitalization at $1.086 trillion.
The issue is not the sign, but the scale. +0.22% is a technical exit from negative territory, not a demand recovery. During the active growth phases of 2024-2025, the indicator held steadily above +10-17%. The current reading only says that selling pressure has eased, but the market has not received new spot capital yet. Confirmation requires holding above +1% for 7-10 days.
Bitcoin Realized Cap HODL Waves
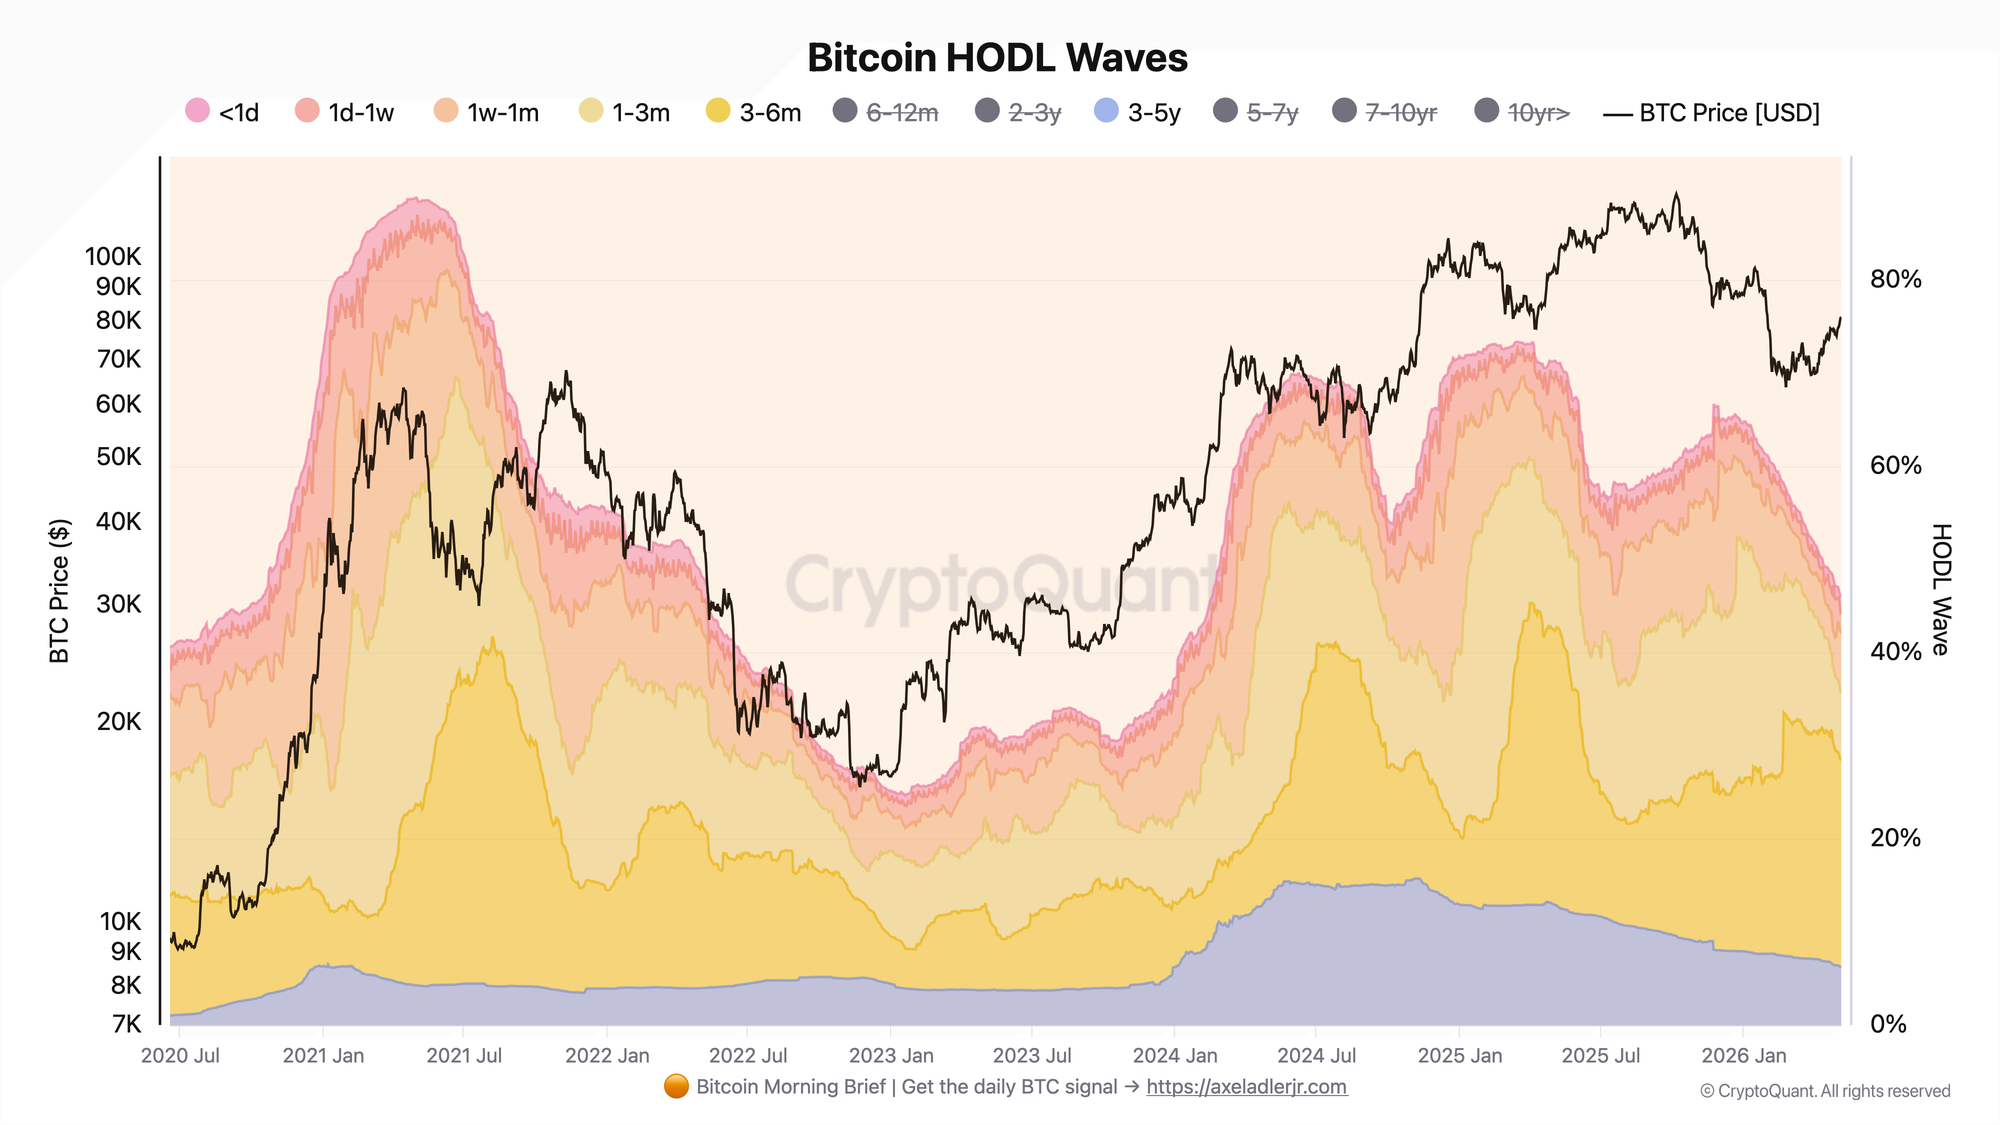
The distribution of realized capitalization by coin age shows which cohorts were moving capital within the network over the past quarter.
From February to May 2026, the main seller was the 1-3 month cohort: -12.4 pp. These are coins bought in November-February in the $75,000-$100,000 range. Some holders sold at a loss, others exited near breakeven. Additional pressure came from the 1 week-1 month (-2.4 pp) and 3-5 year (-1.4 pp) cohorts. Meanwhile, the 6-12 month cohort grew by +9.5 pp - coins bought in mid-2025 remained in holding and formed a base of more stable supply.
STH capitulation has already happened. The buyers of the highs have sold their positions, and the coins have moved to more patient holders. This is a sign that the selling wave is over, but not a sign of a new buyer appearing.
HODL Waves give a direct answer to the question: there are no new buyers on the spot market. The market has been living off redistribution within the existing holder base. That is exactly why Realized Cap has only barely moved above zero - not because new capital arrived, but because the STH seller is nearly exhausted.
Outperform Buy & Hold with a rules-based strategy - Start free. One weekly action, clear triggers, and invalidation levels. No guessing.
FAQ
What does a negative Realized Cap Change mean in practice? Over the rolling 30-day period, more capital was leaving the network at realized prices than entering it. This does not necessarily mean a price crash, but almost always points to the absence of confident spot demand. The market is sustained by redistribution, not fresh inflows.
At what value can we speak of a real demand recovery? Historically, a sustained move above +1-2% held for more than 10 days corresponded to the start of a full recovery trend. If the indicator returns to zero next week, the signal will be cancelled.
CONCLUSIONS
Realized Cap has exited a 75-day negative cycle. But this fact on its own is not bullish. HODL Waves show that the move to zero was driven not by new capital inflows, but by the exhaustion of the STH seller. Buyers from November-February in the $75K-$100K range have largely distributed their positions, coins have moved into more stable hands, and selling pressure has eased. But the resulting void has not yet been filled by new demand.
The current regime is neutral. The main confirmation trigger is a sustained rise of Realized Cap 30D above +1% while price holds above $82,000. The main risk is a new macro wave that reactivates remaining STH holders and pushes the indicator back into negative territory.
Further Reading
- Bitcoin LTH vs STH: Supply Dynamics, Cost Basis & Market Structure
- Bitcoin STH Realized Price: Definition, Formula & Cost Basis Framework
- Realized Price UTXO Age Bands: Definition & HODLer Signals
- Bitcoin Short-Term Holder Profitability: Break-Even as Bull/Bear Signal
- Bitcoin STH SOPR: What It Is and How to Use It