
🎧 Morning Brief #139 - audio debate on today’s market setup
The market enters April under sustained selling pressure: both indicators - Net Realized Profit/Loss and STH SOPR - are signaling a dominance of loss-realizing activity against the backdrop of BTC's ongoing correction.
TL;DR
Short-term holders continue to realize losses: the 7DMA Net Realized P/L has dropped to -$410M, while STH SOPR has held below 1.0 for nine consecutive days. This points to a persistent loss-driven unloading by short-term capital. For pressure to ease, both indicators need to return to neutral levels.
Bitcoin Net Realized Profit/Loss
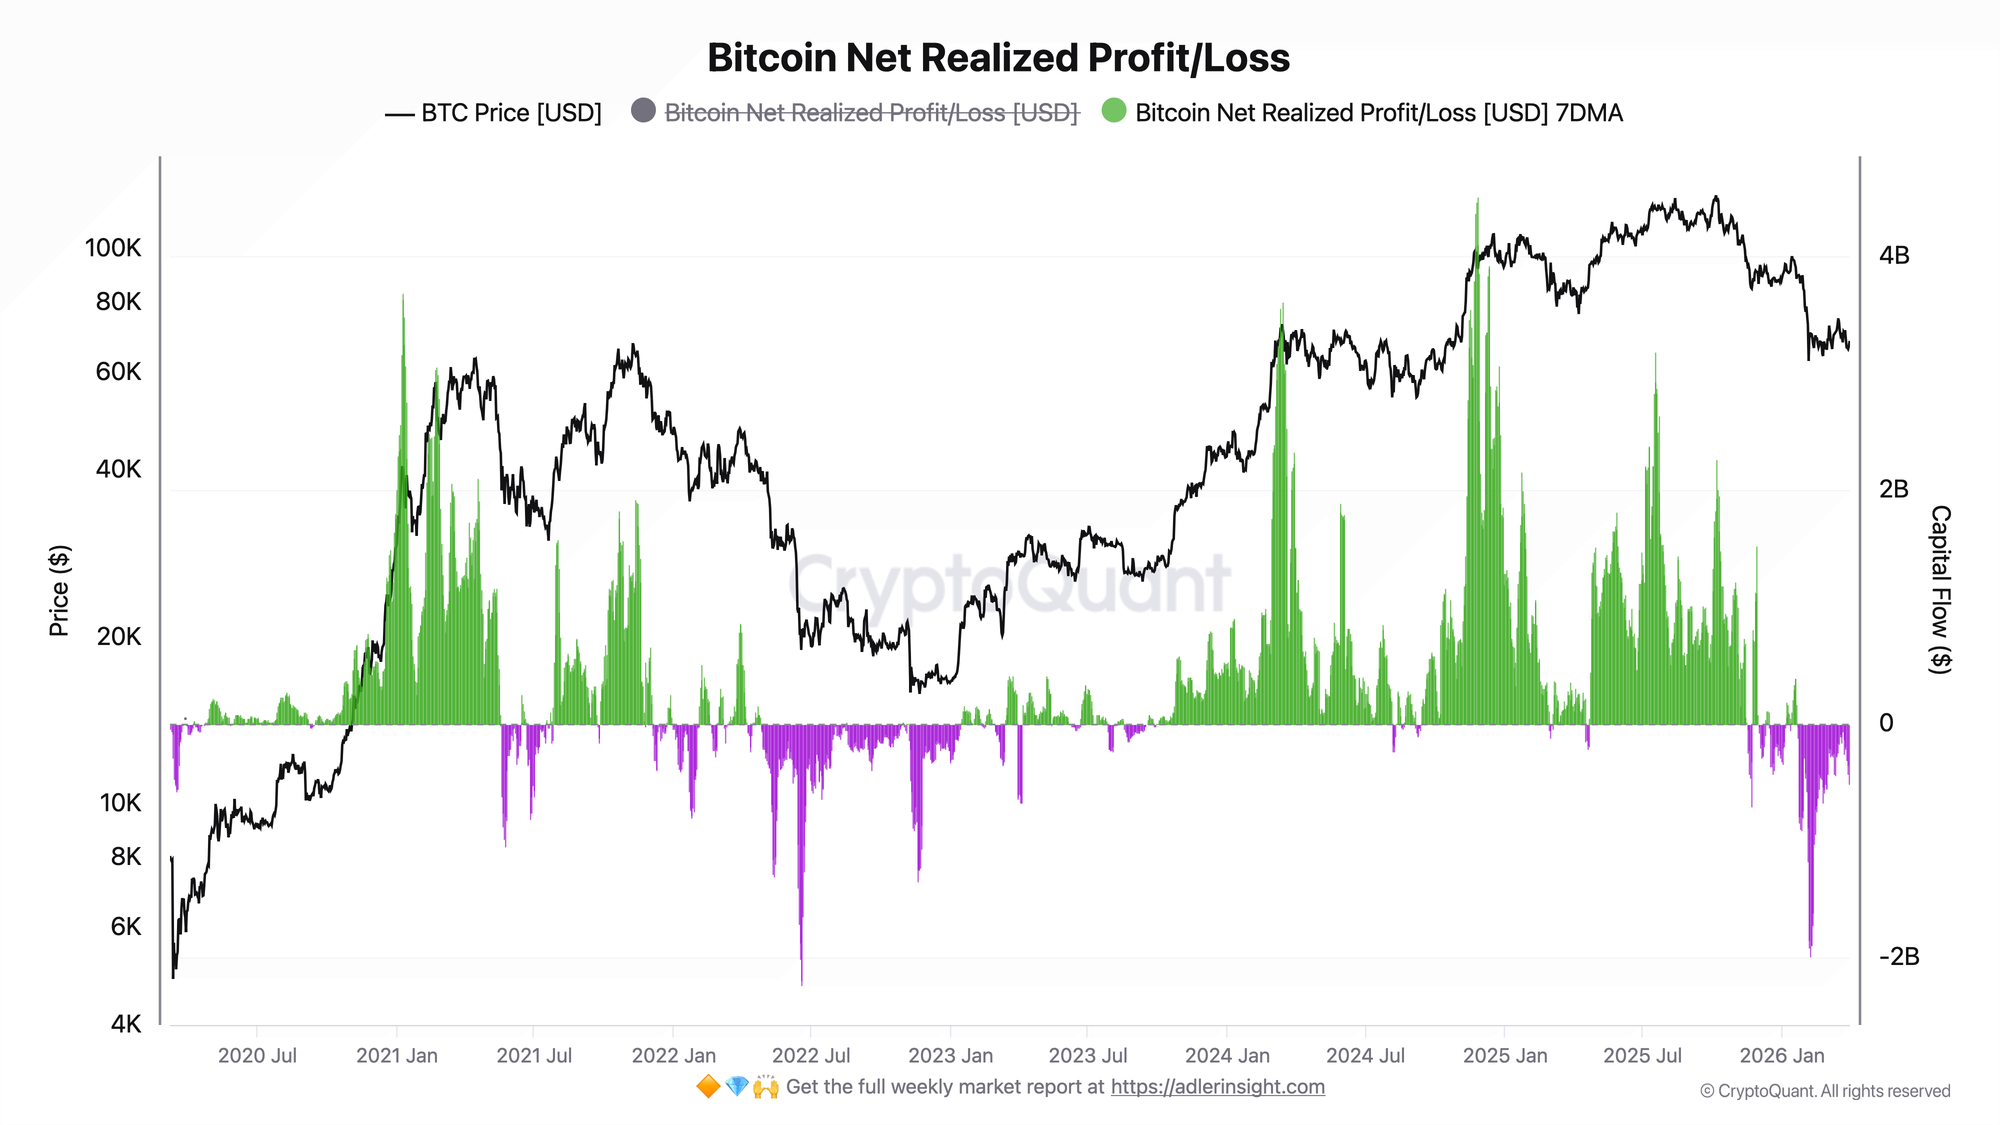
The metric reflects the total realized P/L of all coins moved on-chain: green bars represent net profit, purple bars represent net loss.
The 7DMA Net Realized P/L as of early April came in at -$410M - a deterioration of $154M over the week. This shows that loss-selling pressure has intensified again. The deepest 7DMA reading in Q1 was recorded on February 7 at -$1.99B. The quarterly peak in positive flow was observed on January 19, reaching +$394M, meaning the market underwent a wide reversal in this metric over the course of the quarter.
In terms of cumulative negative Net Realized P/L, the current phase still falls notably short of the 2021-2022 bear market. From November 2021 through December 2022, the market accumulated approximately -$125.2B in negative daily net, whereas from October 2025 through end of March 2026, the figure stands at -$64.2B. In other words, current pressure remains roughly half as large by total realized loss volume, even though individual negative days are already of comparable intensity.
Bitcoin Short-Term Holders SOPR Indicator
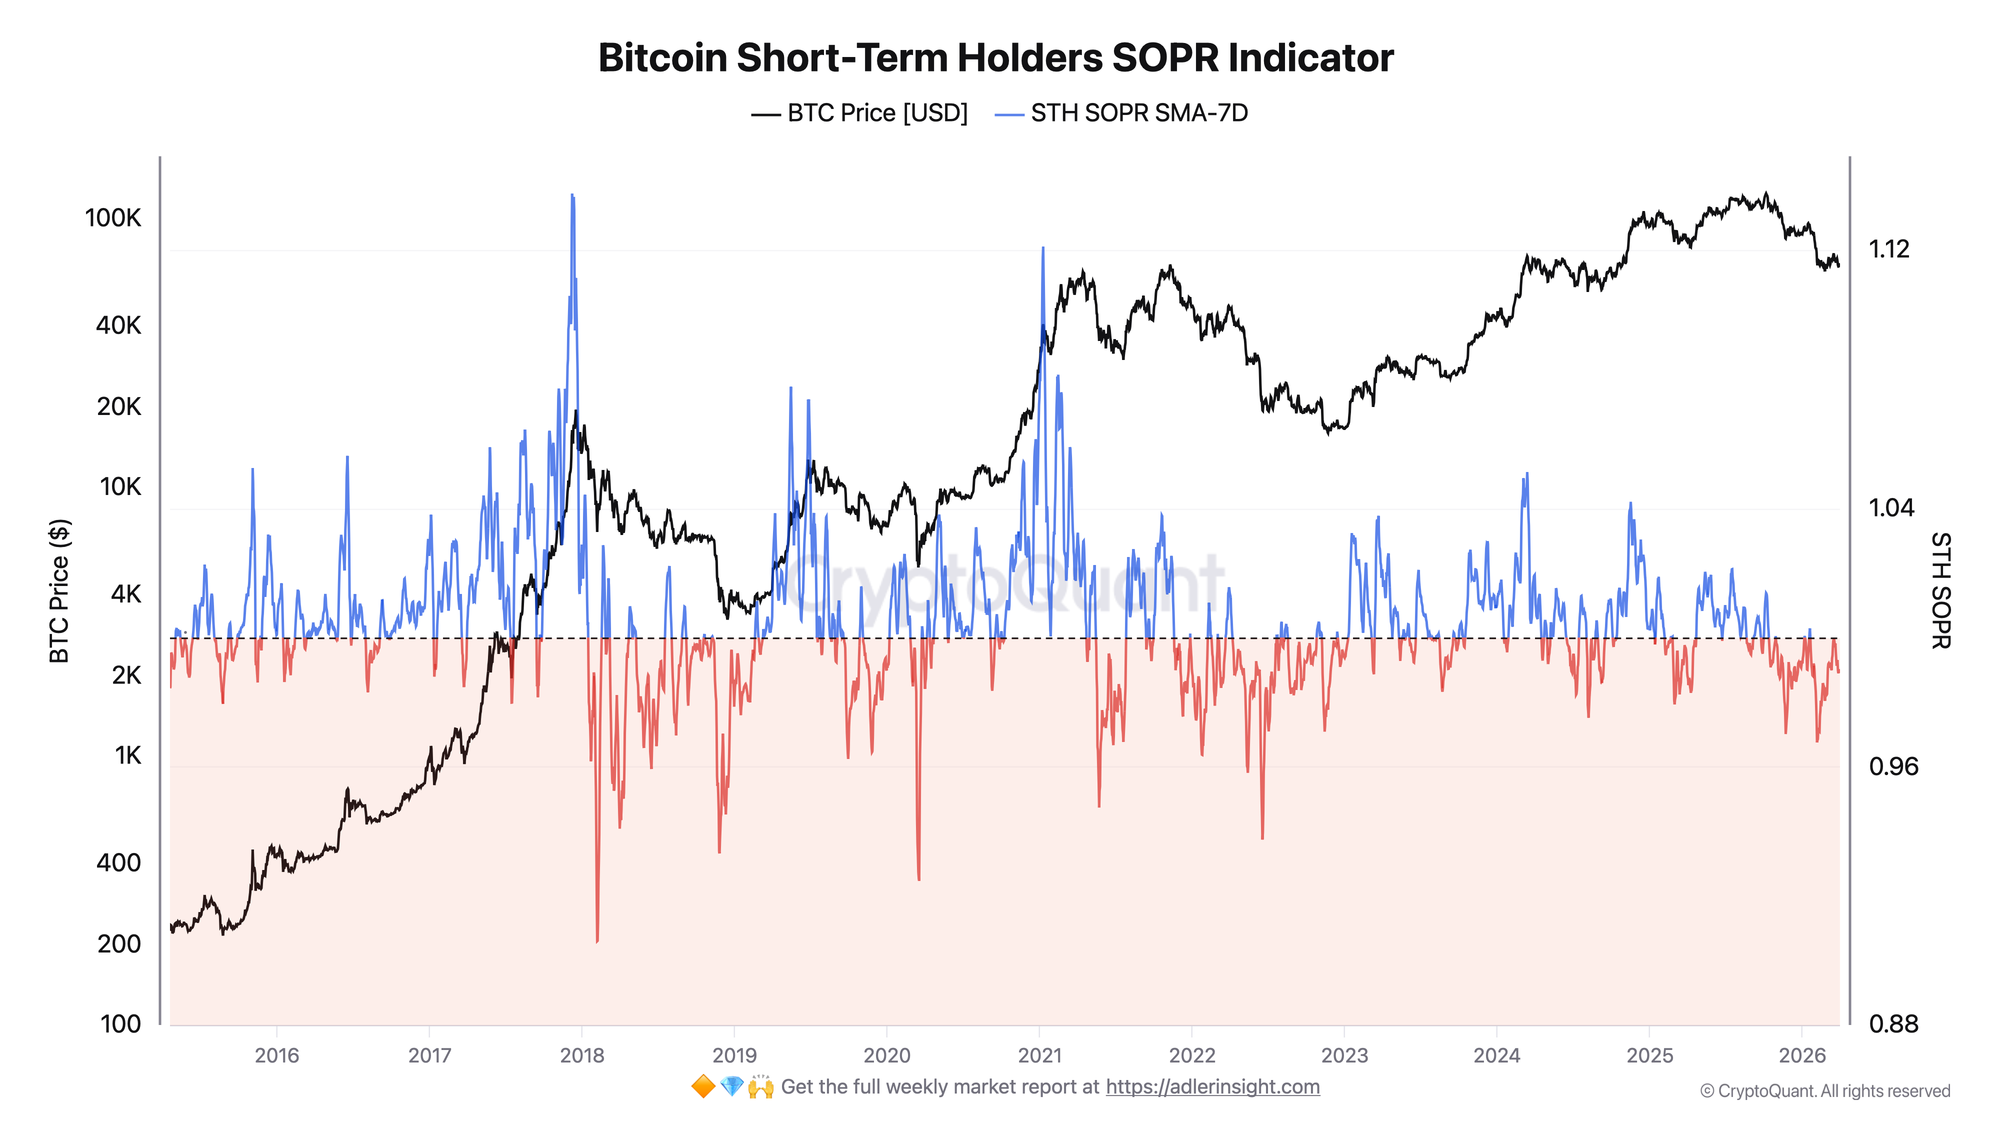
STH SOPR measures the average ratio of sale price to acquisition price for coins held less than 155 days: values below 1.0 indicate selling below cost basis.
Short-term holders continue to exit the market at a loss. Historically, a prolonged period of STH SOPR below 1.0 reflects a stress phase for short-term participants. Such a regime typically ends either with stabilization and gradual recovery, or with a new leg down if price pressure persists. The key signal of improvement therefore remains the same - a confident return of the 7DMA above 1.0 and a sustained hold above that level.
Both indicators confirm the same picture: short-term market participants are selling at a loss, and pressure has intensified over the past week. Net Realized P/L captures the scale of losses in dollar terms, while STH SOPR reflects the systemic nature of these sales at the cohort behavior level. Together they point to a phase of pronounced short-term capital stress - but without the panic extremes characteristic of the final stages of a bear market.
👀 Stop holding through every crash - start your 7-day free trial. Weekly Engine tells you when to stay in, when to step aside, and when risk is rising.
FAQ
Does STH SOPR below 1.0 mean an inevitable further price decline? No. This signal simply shows that a significant portion of short-term holders are currently selling below their cost basis. Historically, such periods can accompany both the formation of a local bottom and continued pressure, so the 0.989-0.990 level in isolation is not a sell signal.
Under what condition would the regime shift to neutral or more stable? This would require STH SOPR 7DMA to return above 1.0 with a sustained hold, alongside a simultaneous exit of Net Realized P/L 7DMA from negative territory. That would indicate the market has stopped systemically realizing losses at the short-term cohort level. Without price stabilization above the STH cost basis zone, such a scenario remains unlikely.
CONCLUSIONS
Net Realized P/L 7DMA has deepened to -$410M with a $154M deterioration over the week, while STH SOPR has slipped to 0.9899 - both indicators synchronously pointing to intensifying pressure from short-term holders. BTC remains nearly 30% below January highs, so the market continues to digest a phase of loss-driven unloading. The primary trigger for reassessing this view is a simultaneous return of Net Realized P/L 7DMA above zero and STH SOPR above 1.0. Until then, the base case remains consolidation with sustained downside pressure and the risk of a new wave of loss realizations on any price weakness.
Further Reading