
🎧 Morning Brief #125- audio debate on today’s market setup
The last active selling pressure signal from the Sell-side Risk Ratio was recorded in December 2024 ($107K) - and has been closed ever since. The model now shows an Accumulation Signal, while selling pressure on the network has dropped 6x below the cycle norm. The metric continues to decline, reproducing levels seen during the 2022-2023 bear market - at prices of $16K-$20K.
TL;DR
The model has divided the current cycle into two phases: strong distribution ($64K-$107K, November-December 2024) and a return to accumulation (now). Sellers are gone - and show no signs of returning.
Bitcoin Adaptive Sell-side Risk Ratio - Accumulation & Distribution Signals
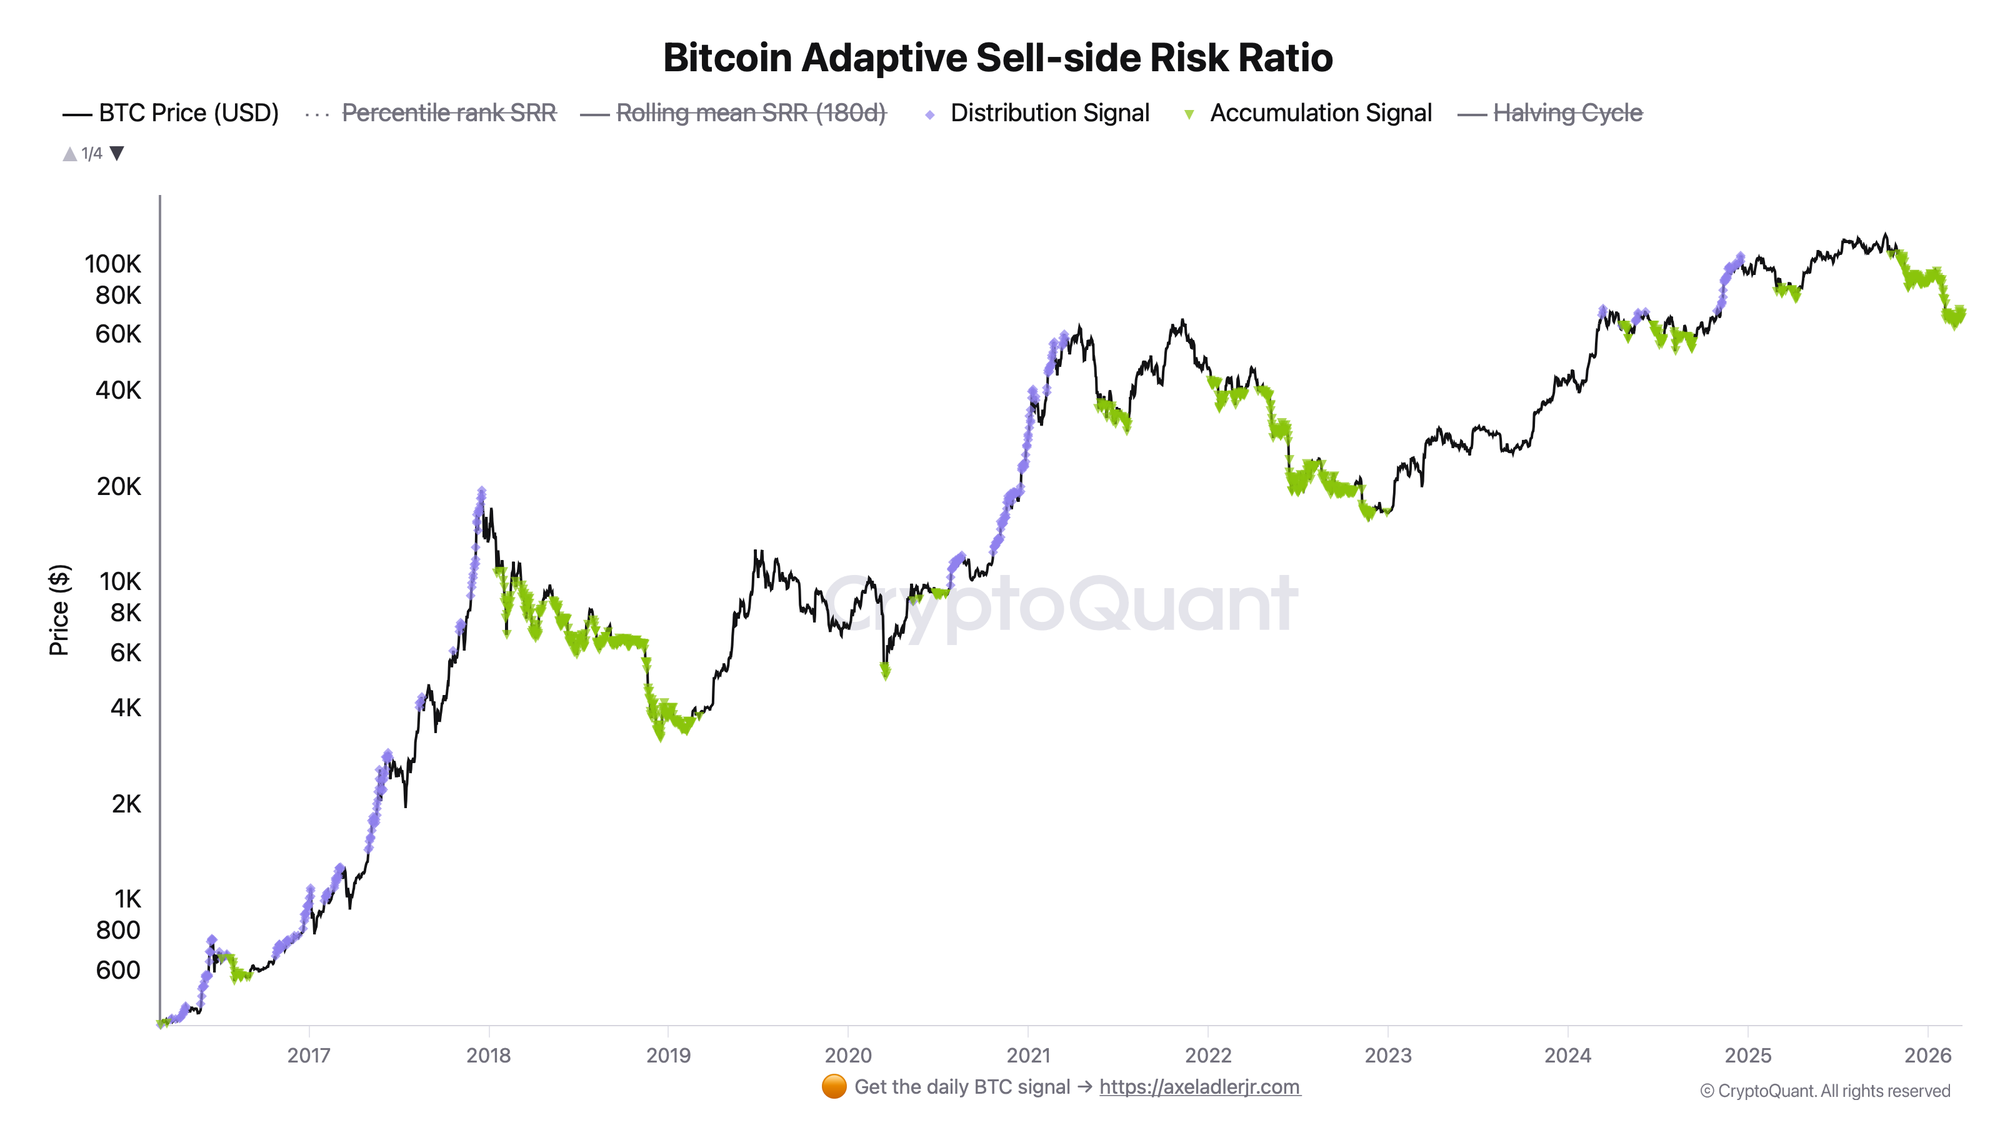
The Sell-side Risk Ratio shows how actively market participants are taking profit relative to the total cost basis of the network. When the value rises above the adaptive upper threshold - the model triggers a Distribution Signal (purple dots): sellers are dominating. When the metric falls below the lower threshold - an Accumulation Signal activates (green dots): selling pressure is minimal, the market is in accumulation mode.
In the current cycle, the Distribution Signal first appeared on April 20, 2024 (halving day, $64K), then disappeared - and reactivated in November 2024 as the price broke through $74K, holding through December 17, 2024 ($107K). In total, 37 days of distribution covered the entire rally from $64K to the $107K peak - the model correctly flagged this range as a zone of active selling. After December 17 the signal closed and has not reopened: as of current data, the market has gone 449 days without a Distribution Signal. The Accumulation Signal began appearing episodically from October 2025, and the current continuous green mode has been running since January 18, 2026.
Conclusion: sellers who had accumulated positions at low prices realized them in the $64K-$107K corridor. Those who did not sell then are now holding their coins and refusing to sell. A new Distribution Signal requires either a return of price to $100K+ with active profit-taking, or the emergence of a new pool of sellers.
Rolling Mean SRR (180d): The Metric Continues to Fall
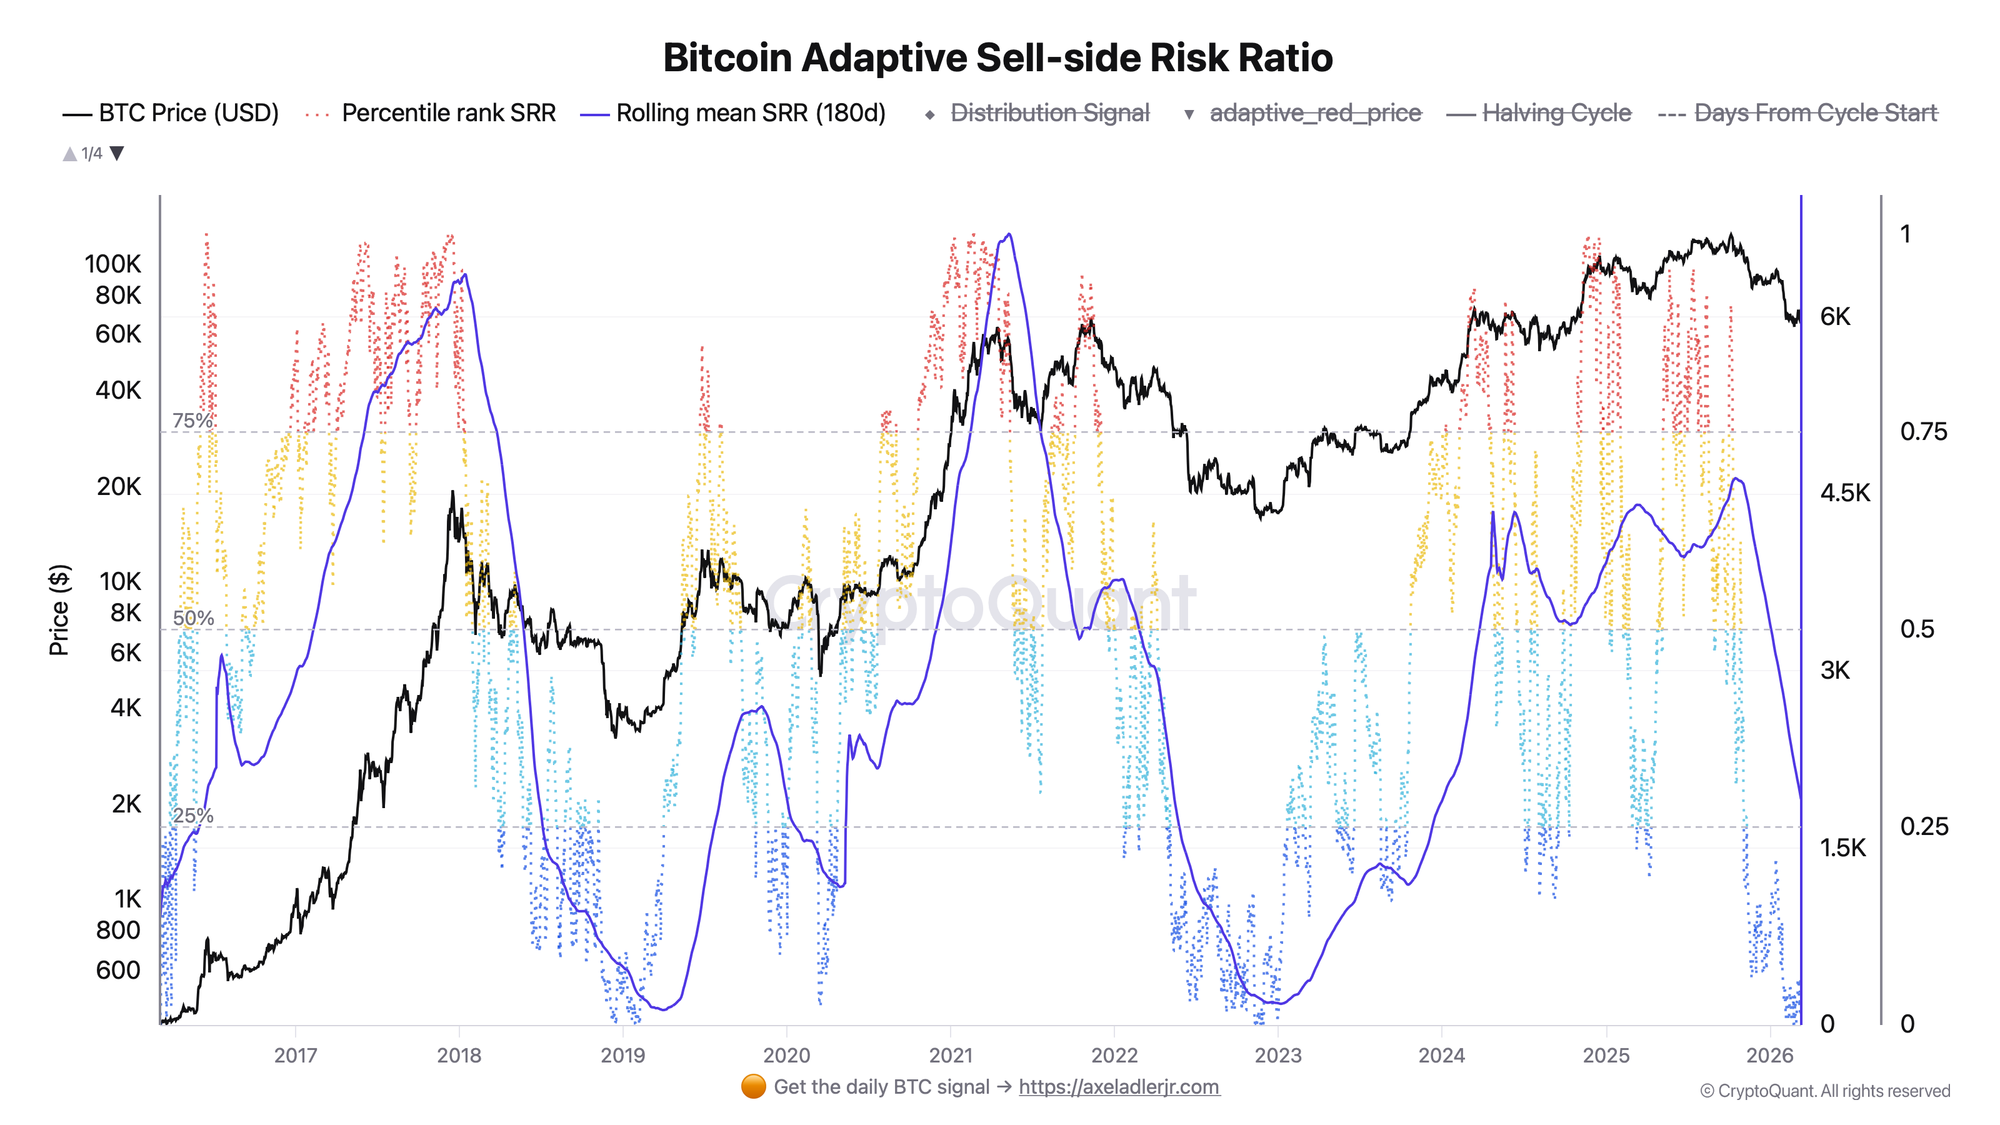
The blue line on the chart - the 180-day average of the Sell-side Risk Ratio - shows what the market currently considers a "normal" level of selling pressure. In previous cycles it rose alongside price and peaked at the same time as the ATH - that was precisely when the Distribution Signal appeared. After the peak it collapsed downward in the bear phase.
Now the Rolling Mean SRR is behaving differently: it has fallen from 3,210 to 1,913 over the last 60 days (-1,297 points) and continues declining at approximately 20 points per day. Values of 1,500-2,000 in previous cycles corresponded to 2019 ($3K-$6K) and the middle of the 2022-2023 bear market ($16K-$20K). The same numbers appear on the line now - but the price is $67K-$72K. This is the key structural divergence of the current cycle: seller behavior matches a bear phase, but price does not.
Link to the first chart: the Distribution Signal closed in December 2024, after which the Rolling Mean SRR began its current decline. Since then both indicators are saying the same thing: selling pressure has dropped sharply, and the market has moved into a phase of reduced profit and loss realization. The Percentile rank SRR has fallen to minimum values, similar to 2019 and 2023.
FAQ
What does the Distribution Signal mean? The Distribution Signal activates when selling pressure on the network exceeds the model's adaptive upper threshold - meaning market participants are taking profit significantly more actively than the cycle average. This is not a reversal signal or a peak forecast: it only indicates that there are currently an abnormally high number of sellers. In the current cycle the signal ran for 37 days in the $64K-$107K range (April and November-December 2024), then closed. Notably, the ATH of $124K in October 2025 was reached without a Distribution Signal - the model registered no major concentration of sellers at that level.
When will the green Accumulation Signal disappear? For a new Distribution Signal, the indicator must again exceed the adaptive upper threshold - currently around 6,237 points. At the current value of 551, this means an 11x increase, which is only achievable with a sustained price hold above $100K-$110K and mass profit-taking by participants. Until that happens, the model continues to see the market in accumulation mode.
👀 Reading the signal is not enough - you need to act on it. Weekly Engine turns on-chain data into one clear decision per week, with risk caps and invalidation built in. Start free.
CONCLUSIONS
The current cycle has passed through its distribution phase and returned to accumulation, which continues at this moment. Rolling Mean (180D) has collapsed to 1,913 - levels historically associated with bear phases - but at prices of $67K-$72K. Current stance is neutral-accumulative. The primary risk is prolonged consolidation without a price catalyst, under which the Rolling Mean SRR will continue to decline.
Further Reading
- Bitcoin NUPL (Net Unrealized Profit/Loss): What It Is and How to Use It - the closest relative to SRR: both measure unrealized profit/loss pressure across the network
- Bitcoin Supply in Profit: Definition, Thresholds & Market Signals - how the share of profitable coins drives accumulation and distribution cycles
- Realized Profit vs Unrealized Profit: What's the Difference - foundational concepts behind the SRR formula
- Bitcoin LTH vs STH: Supply Dynamics, Cost Basis & Market Structure - why long-term holders refusing to sell is the key driver of suppressed SRR in Cycle 4
- Spot ETFs and Global M2: Thresholds for Overriding the Bitcoin Halving Cycle - structural context for why Cycle 4 sell-side behavior differs from prior cycles