


🎧 Morning Brief #124 ⚡️Extra - audio debate
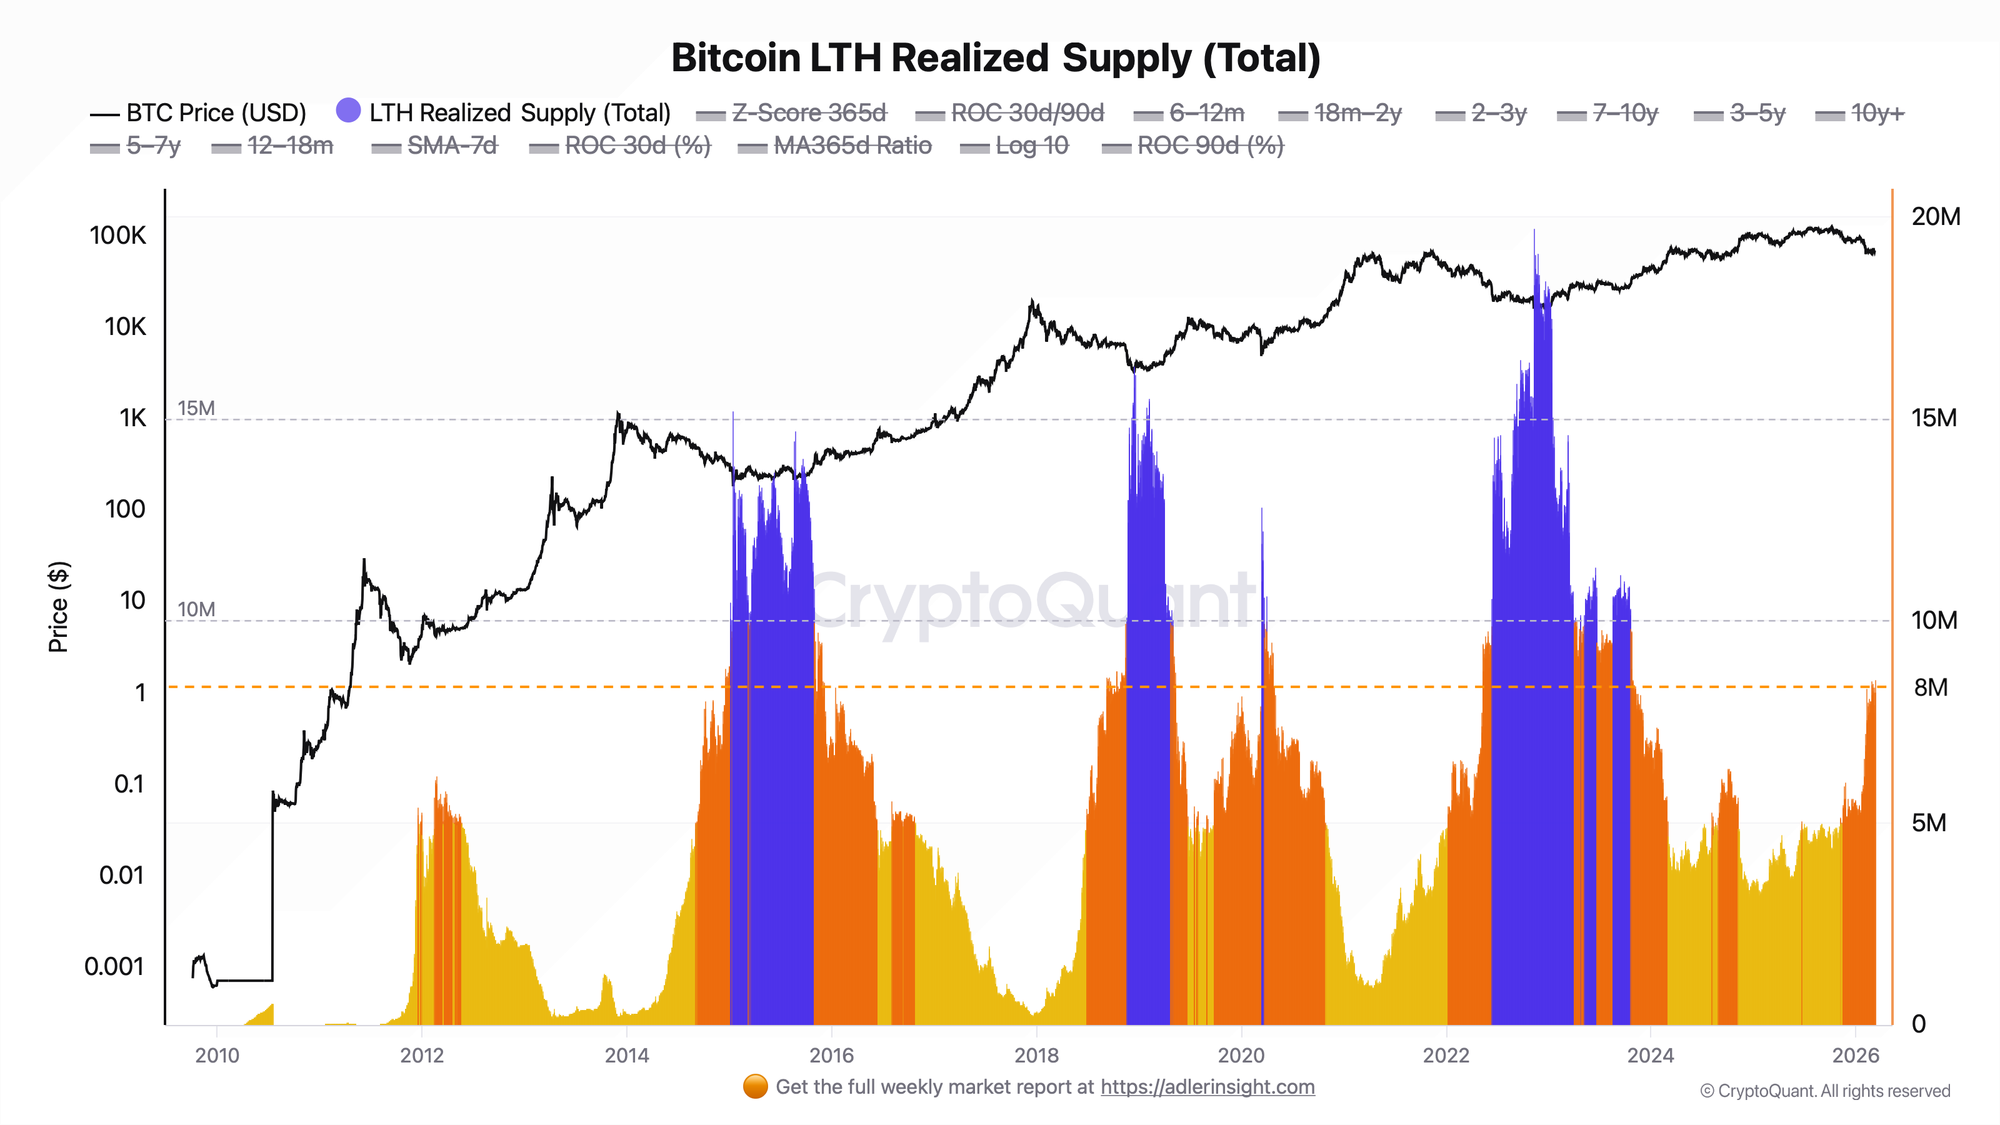
1. Current Status (03/11/2026)
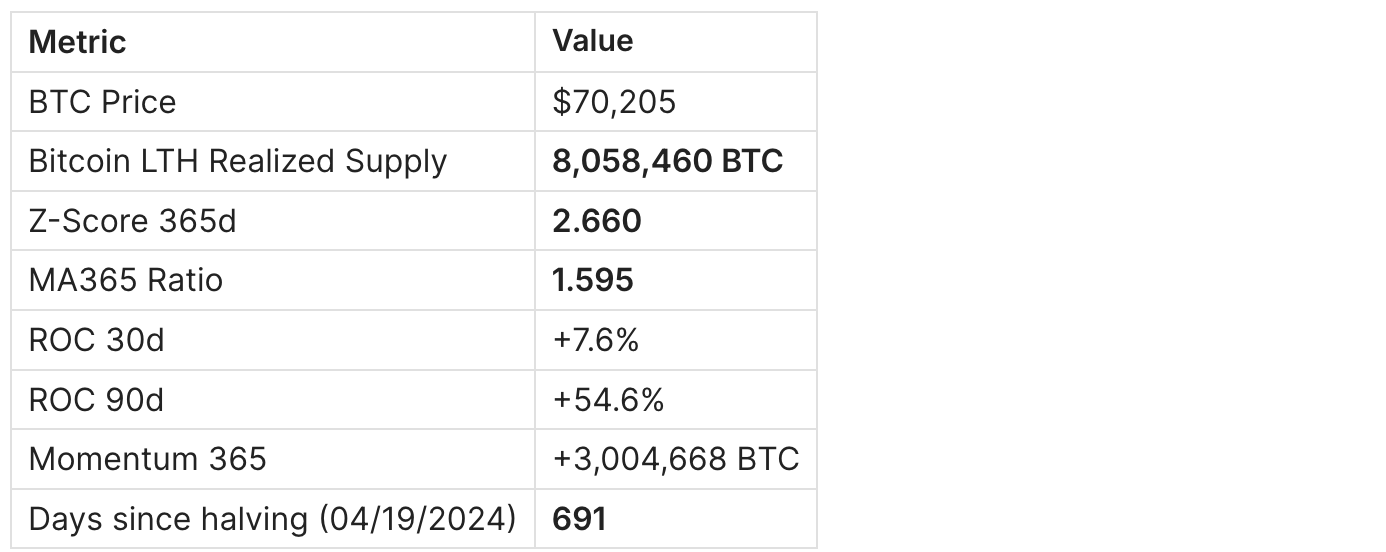
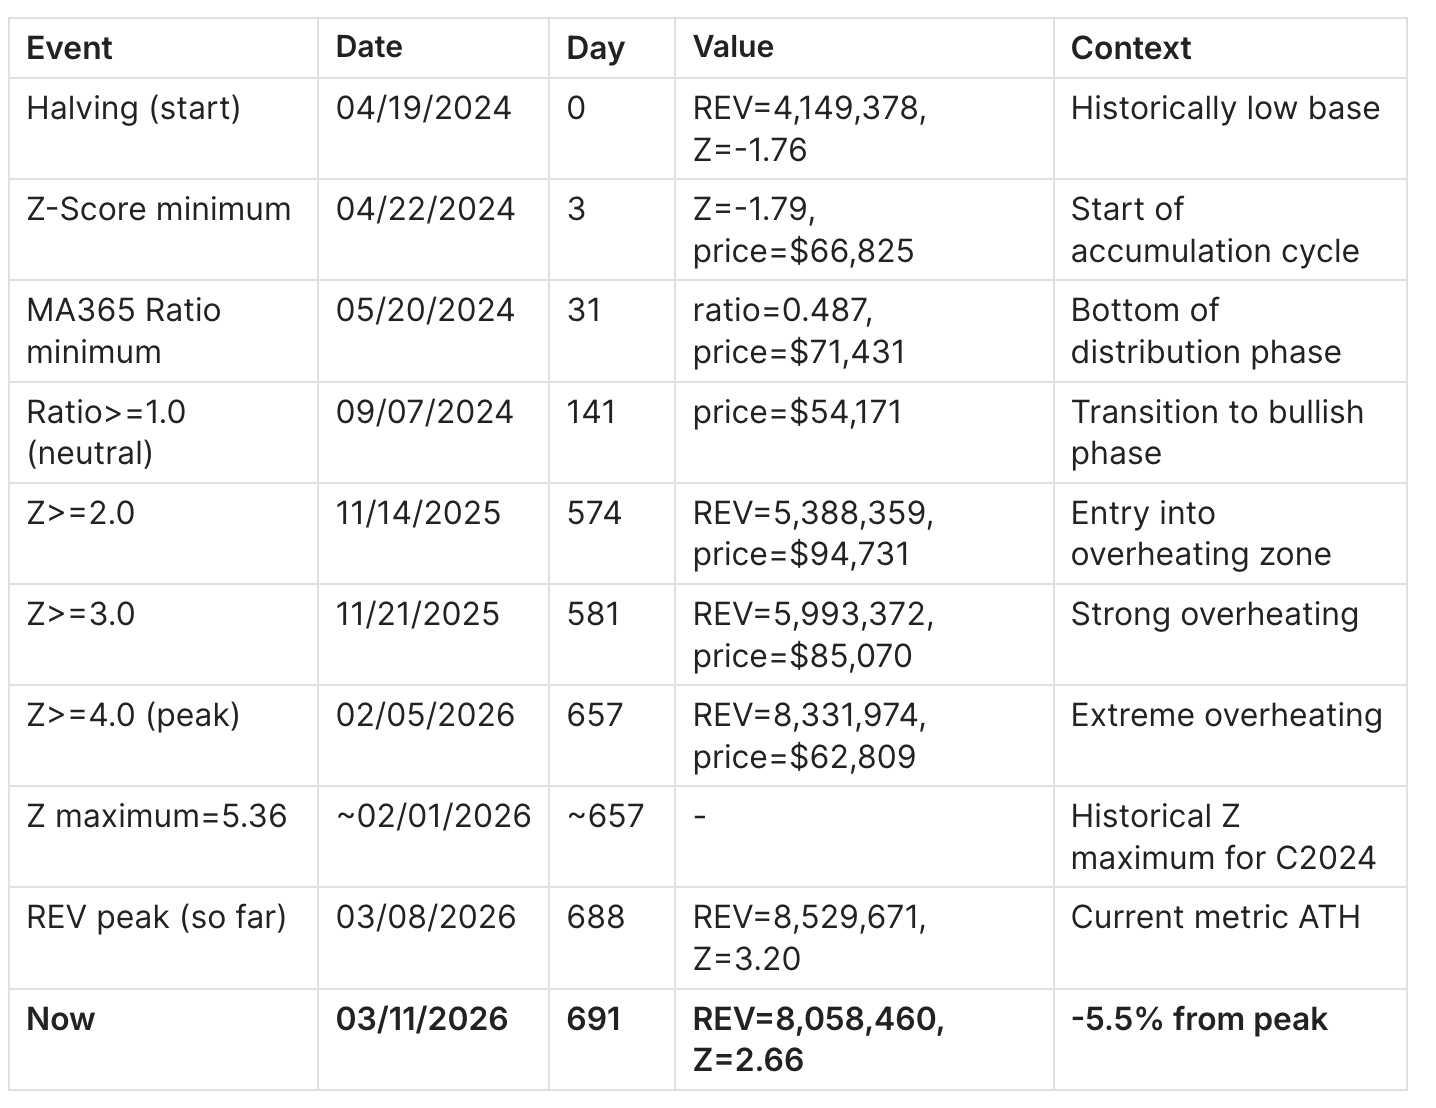
Current cycle peak (C2024): 8,529,671 BTC - 03/08/2026 (day 688), Z=3.20, price $65,974.
Current value is -5.5% from the peak.
2. Cycle Comparison at the Same Point (Day 691)
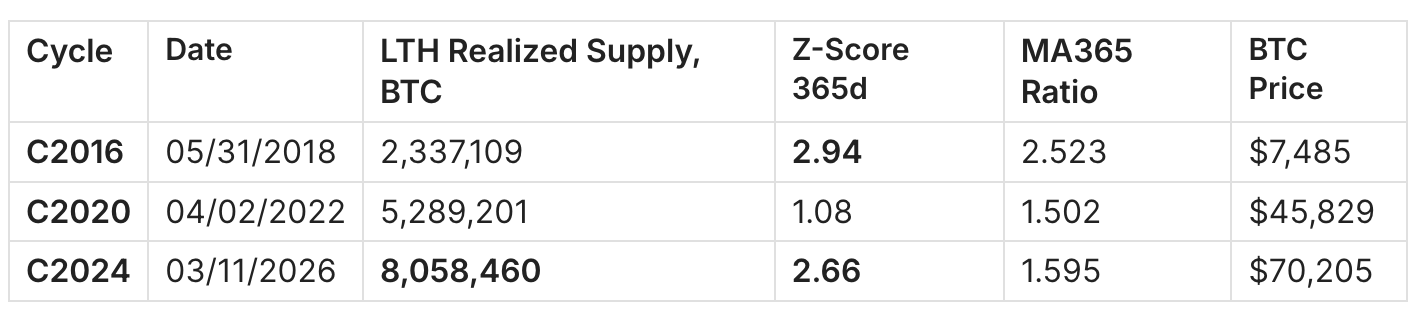
Key observations:
- Bitcoin LTH Realized Supply on 03/11/2026 is a historical maximum for this point in the cycle. The absolute volume of coins held by long-term holders is nearly 1.52x higher than in C2020 (04/02/2022), and 3.4x higher than in C2016 (05/31/2018) at the equivalent post-halving point.
- Z-Score C2024 (2.66) is close to C2016 (2.94) at the equivalent point. This structural similarity is notable: in C2016 in late May 2018, the market was at the beginning of the final redistribution phase, which continued for another ~200 days until the metric's ATH (December 2018).
- C2020 at day 691 after the halving was a fundamentally different situation: Z=1.08 reflected the end of the bear trend following the Terra/LUNA collapse. LTH Realized Supply in C2020 had already been falling for 8 months from its ATH at that point - a structurally different phase.
- MA365 Ratio C2024 (1.595) is the lowest of the three cycles at this point. C2016 had ratio=2.523, C2020=1.502. This means that despite the record absolute volume, the degree of overheating relative to the moving average remains moderate.
3. LTH Realized Supply (Total) Cycle Peaks
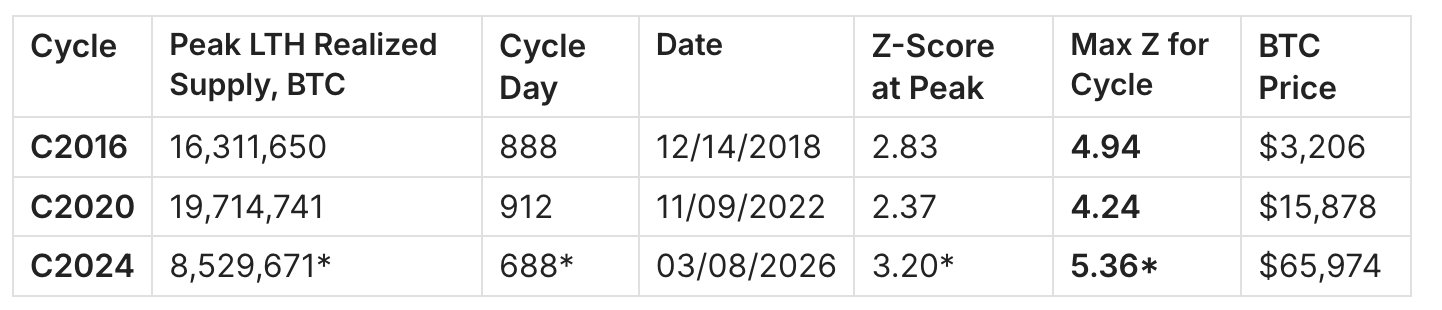
* - preliminary peak, cycle not complete
Interpretation:
In C2016 and C2020, Bitcoin LTH Realized Supply peaks formed at days 880-912 of the cycle - that is, 190-220 days later than the current point in C2024. The maximum Z-Score in those cycles reached 4.24-4.94. If C2024 reproduces the same temporal structure, the current peak (8.5M BTC, Z=3.20) is an intermediate maximum, not the final one.
However, the structure of C2024 is qualitatively different: the peak in absolute terms was reached much earlier. The reason is a changed market composition: ETF inflows locked large volumes of coins in institutional products, reducing the overall share of coins in active circulation. LTH simply exhausted the available supply faster.
4. Z-Score Threshold Crossings
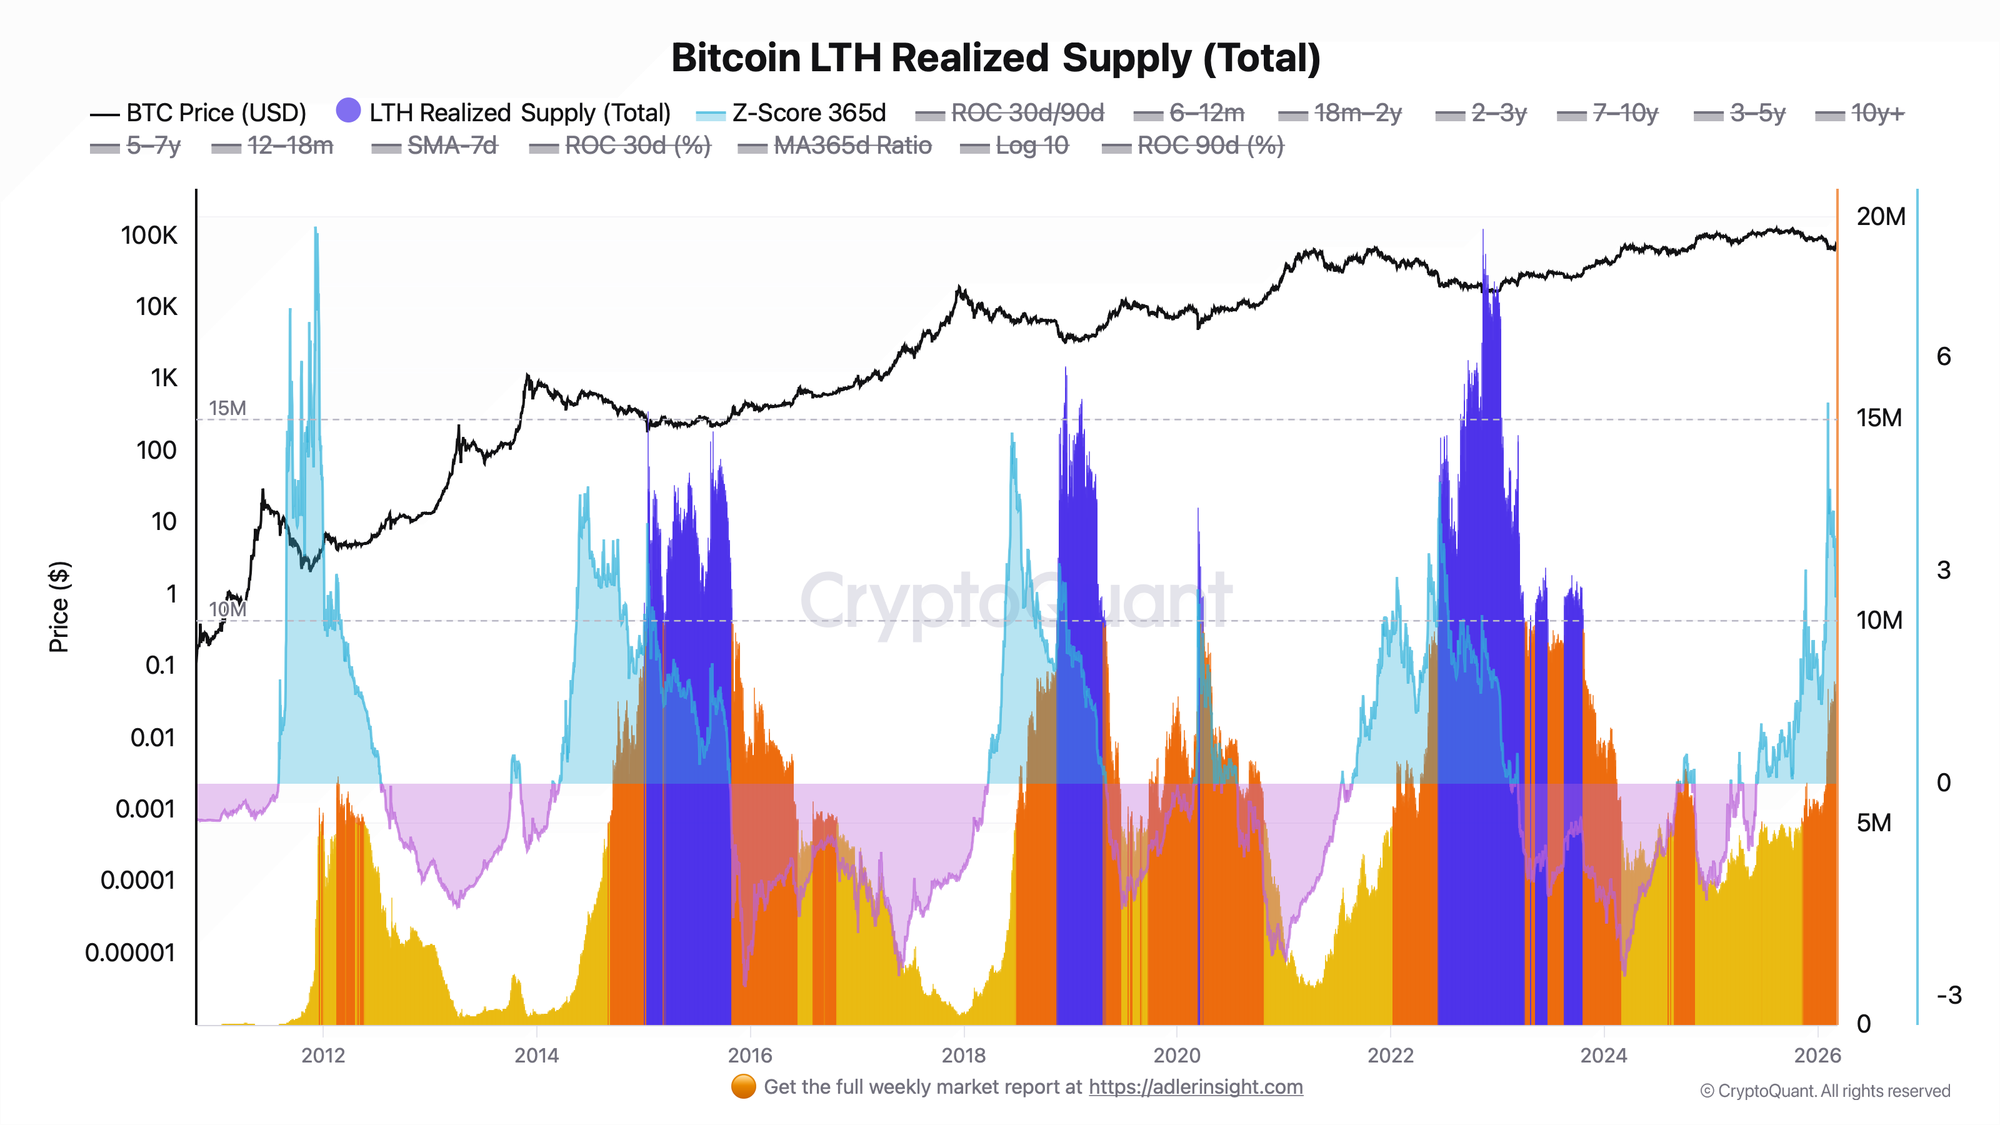
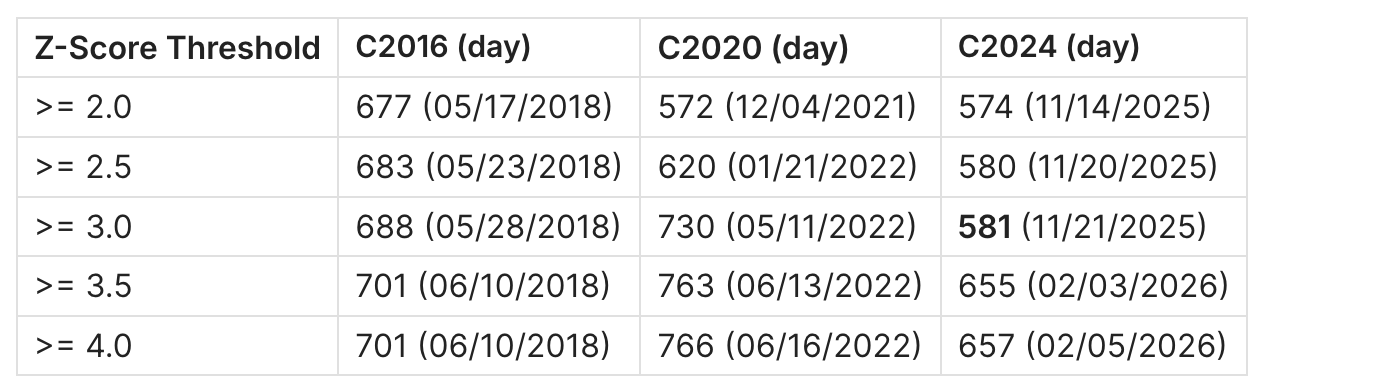
Key conclusions:
- C2024 crossed Z>=3.0 on day 581 - significantly earlier than C2020 (day 730), but nearly identical to C2016 (day 688). This confirms an earlier onset of the redistribution phase in the current cycle.
- The Z=5.36 peak (C2024 cycle maximum recorded in early February) was reached earlier and higher than the equivalent peaks in C2016 and C2020. This may indicate a more compressed cycle.
- In C2016, after crossing Z>=3.0 (day 688), Z continued to rise for another 13 days to a maximum of 4.94 (day 701), then dropped sharply. A similar compression was already observed in C2024: Z reached 5.36 on day 657, but had corrected to 2.66 by 03/11/2026.
5. MA365 Ratio Threshold Crossings
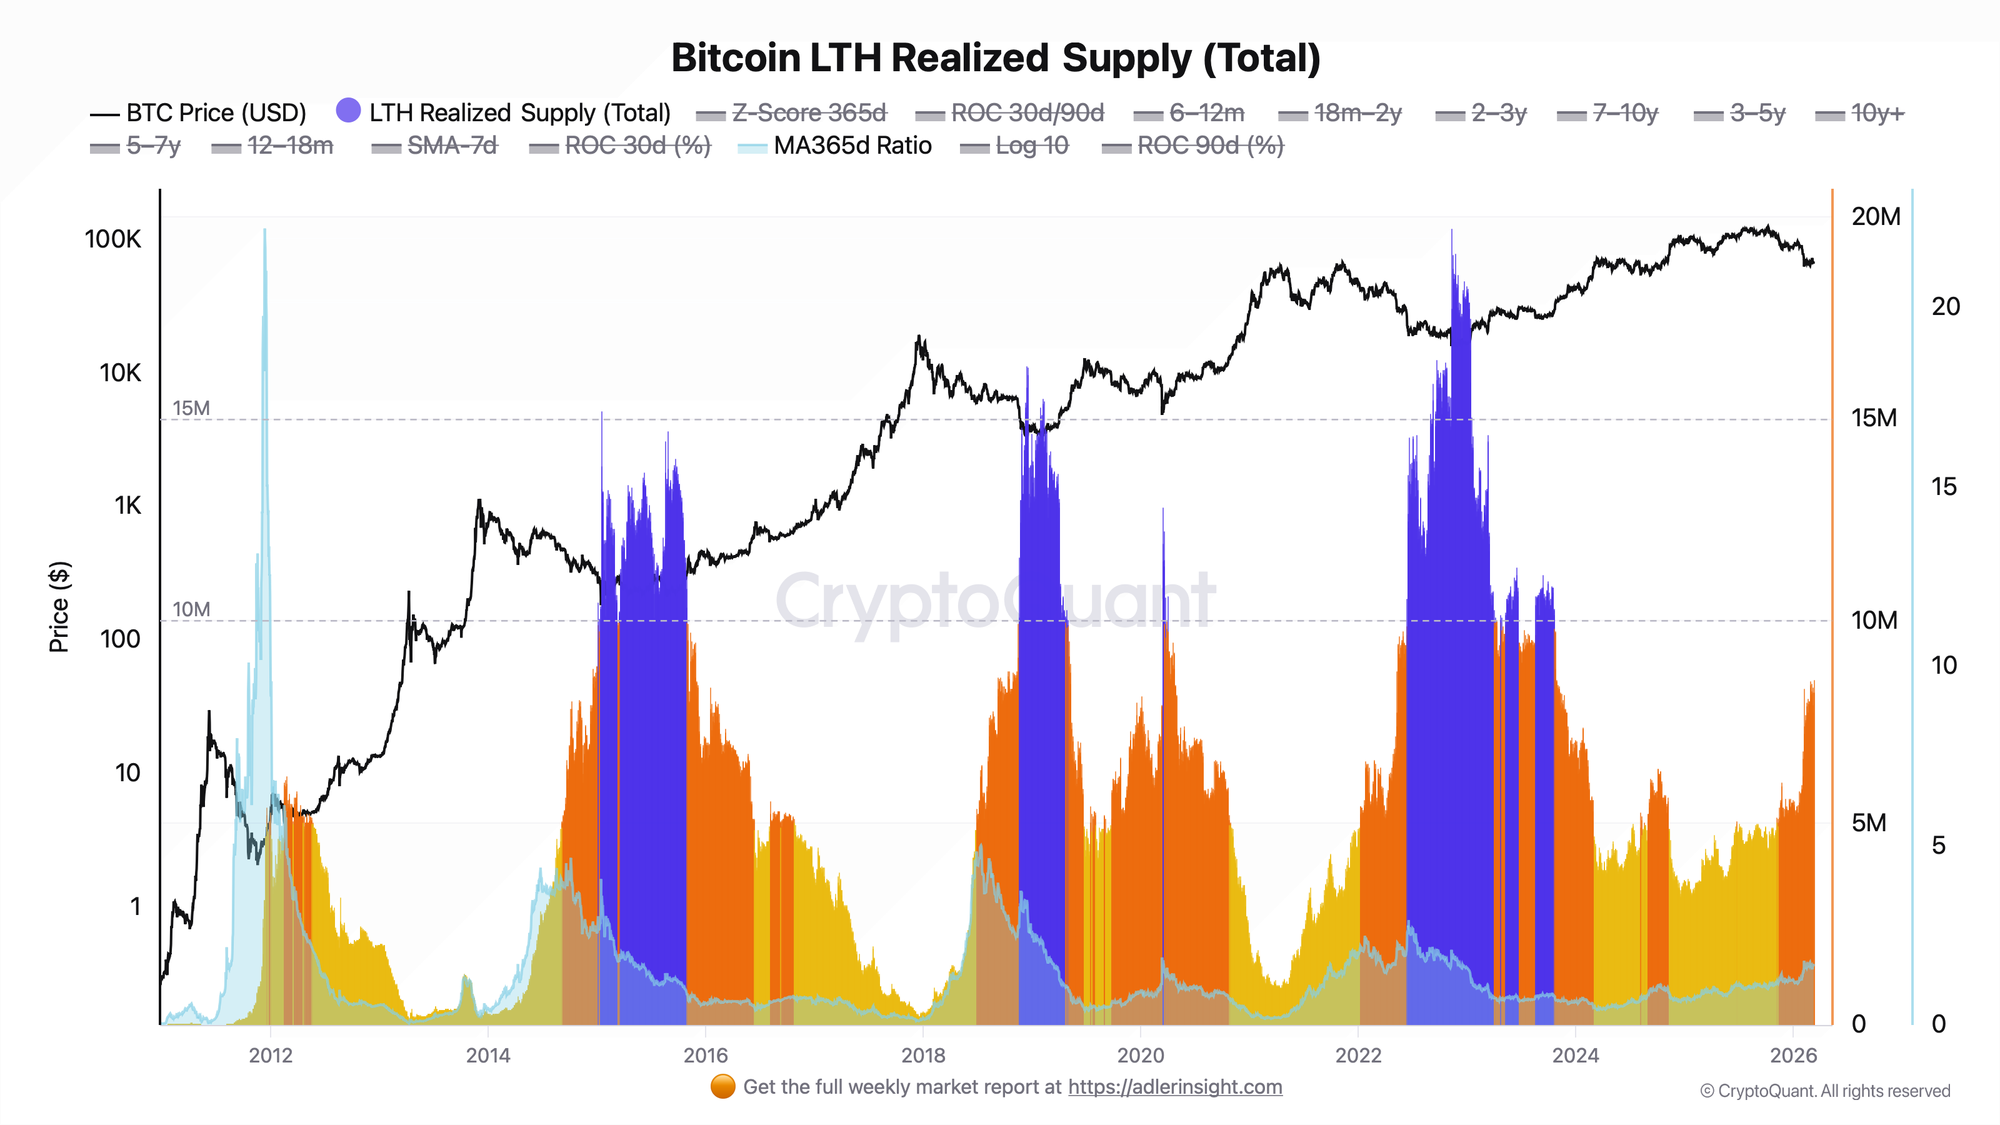
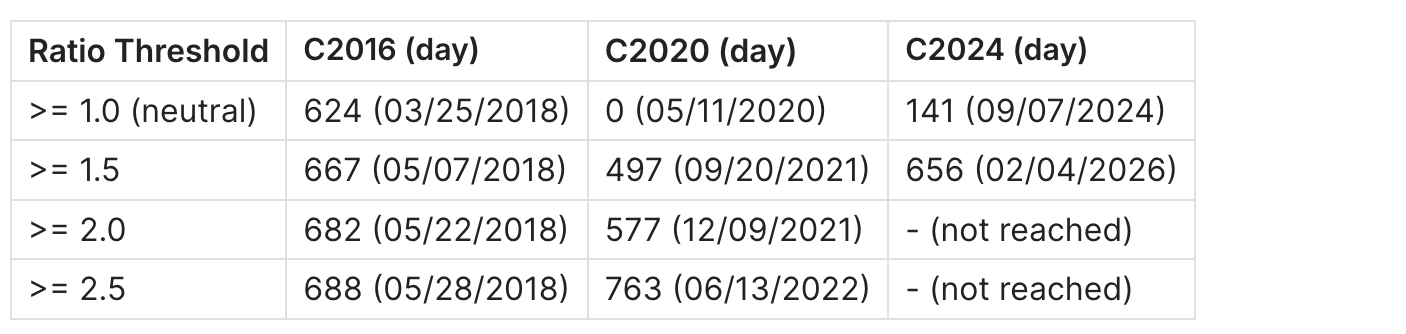
Current MA365 Ratio = 1.595 - the metric is in the moderate overheating zone. In C2016 and C2020, final LTH Realized Supply peaks corresponded to a ratio of 2.5-4.5. The current cycle has not yet reached ratio >= 2.0, which historically coincided with the most intensive phase of coin accumulation by long-term holders (late buyer capitulation).
6. ROC 30d - Context
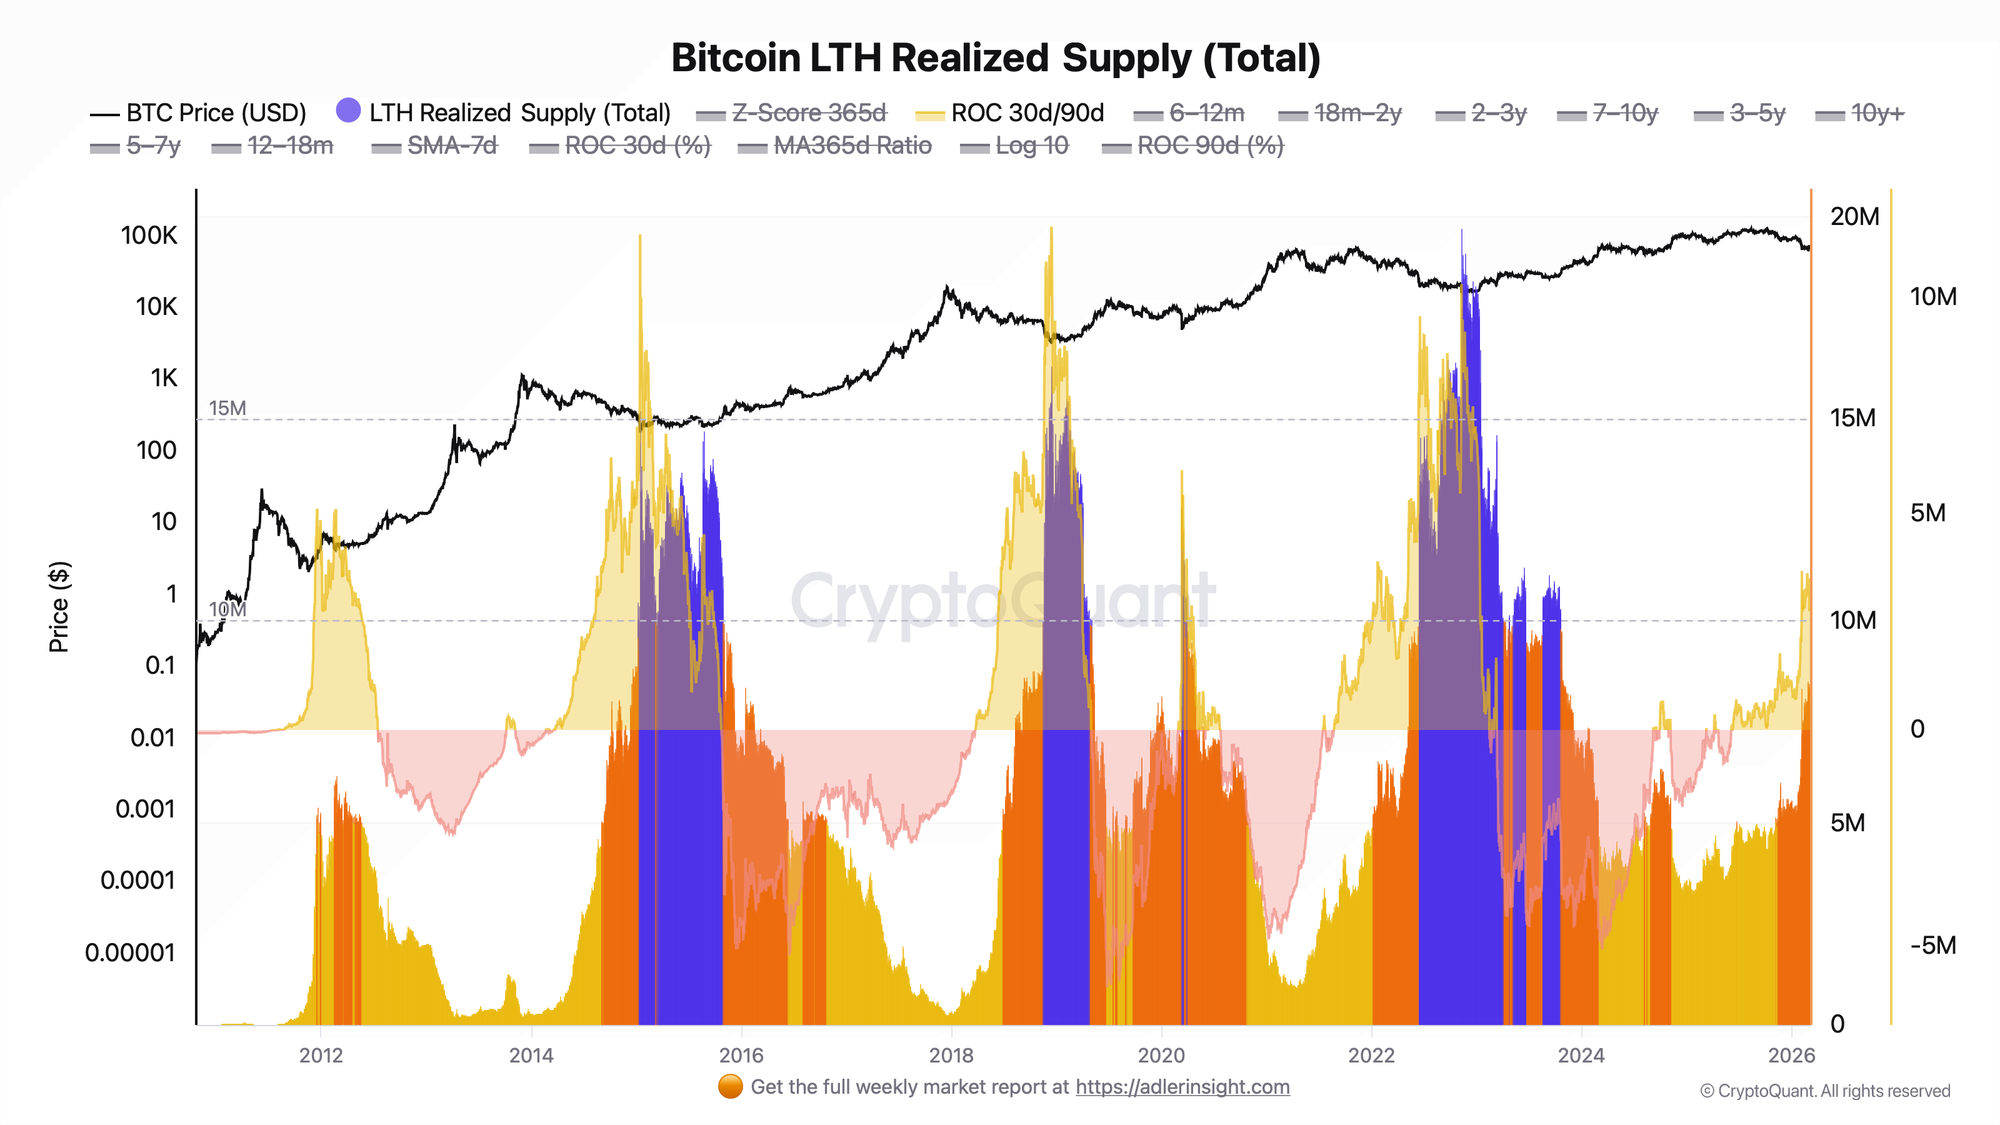

The current ROC 30d (+7.6%) is substantially lower than in the equivalent phases of C2016 (+87%) and C2020 (+51.6%). This points to a slowdown in the accumulation pace: the LTH Realized Supply growth rate declined significantly after the peak values of January-February 2026 (when ROC 30d exceeded 35%). The market is entering a stabilization phase.
7. Key C2024 Phases
8. Summary Assessment
Structural position: C2024 at day 691 shows a Z-Score of 2.66 - close to C2016 at the same point (Z=2.94). In C2016, this moment was the prelude to the final redistribution phase, which continued for another ~200 days with growing coin volume among long-term holders.
Bullish scenario: If the cycle follows the temporal structure of C2016, the current peak is intermediate. The final LTH Realized Supply ATH in C2024 could potentially form at days 870-920 (October-November 2026), with the metric growing to 12-16M BTC at ratio >= 2.0.
Bearish scenario: The record Z-Score (5.36) has already formed and continues to decline - the cycle may be more compact, with redistribution effectively concluding. ROC 30d +7.6% at Z=2.66 confirms fading momentum. The decline in Bitcoin LTH Realized Supply of -5.5% from the peak alongside a price rise to $70,205 indicates weakening BTC-equivalent realized supply in the 6m+ cohorts, though this alone does not yet confirm the start of distribution.
Neutral assessment: Current values (Z=2.66, ratio=1.595) are in the moderate overheating zone with no extreme signals. The market has not reached the historical ratio >= 2.0 characteristic of final peaks in previous cycles - leaving room for the trend to continue. However, the LTH Realized Supply growth rate is slowing, requiring monitoring over a 30-60 day horizon.
> Weekly Engine - Backtest Results (Apr 2015 - present)
| Strategy | Final Value | Total Return | Max Drawdown |
|---|---|---|---|
| BUY/EXIT | $4.85M | +485,362% | -54.7% |
| HODL | $262K | +26,097% | -82.9% |
$1,000 starting capital. 3 full cycles completed. Currently in cash since October 2025 EXIT at $114,788.
See full backtest: trade log, cycle-by-cycle breakdown & Sharpe ratio →
Further Reading
Core concepts behind this analysis:
- Bitcoin LTH vs STH: Supply Dynamics, Cost Basis & Market Structure
- STH vs LTH Realized Price: Support & Resistance Guide
- The 4-Year Bitcoin Cycle: Definition, Mechanics & Historical Evidence
Cycle positioning & market sentiment:
- MVRV Z-Score: How to Identify Bitcoin Market Tops and Bottoms
- Bitcoin NUPL (Net Unrealized Profit/Loss): What It Is and How to Use It
- Bitcoin Supply in Profit: Definition, Thresholds & Market Signals
Cycle compression & macro context:
- Spot ETFs and Global M2: Thresholds for Overriding the Bitcoin Halving Cycle
- Death of the 4-Year Cycle? Macro Liquidity vs. Halving
- Bitcoin VDD Multiple: Cycle Top Signals & Probability Zones
Coin age & holder behavior: