
Open Interest and price don't always move in the same direction - and when they diverge, the resulting signal is more powerful than either metric alone. This guide breaks down the four OI-Price regimes, shows what each one looked like in real Bitcoin cycles, and gives you a repeatable framework for acting on divergences before the crowd.
TL;DR
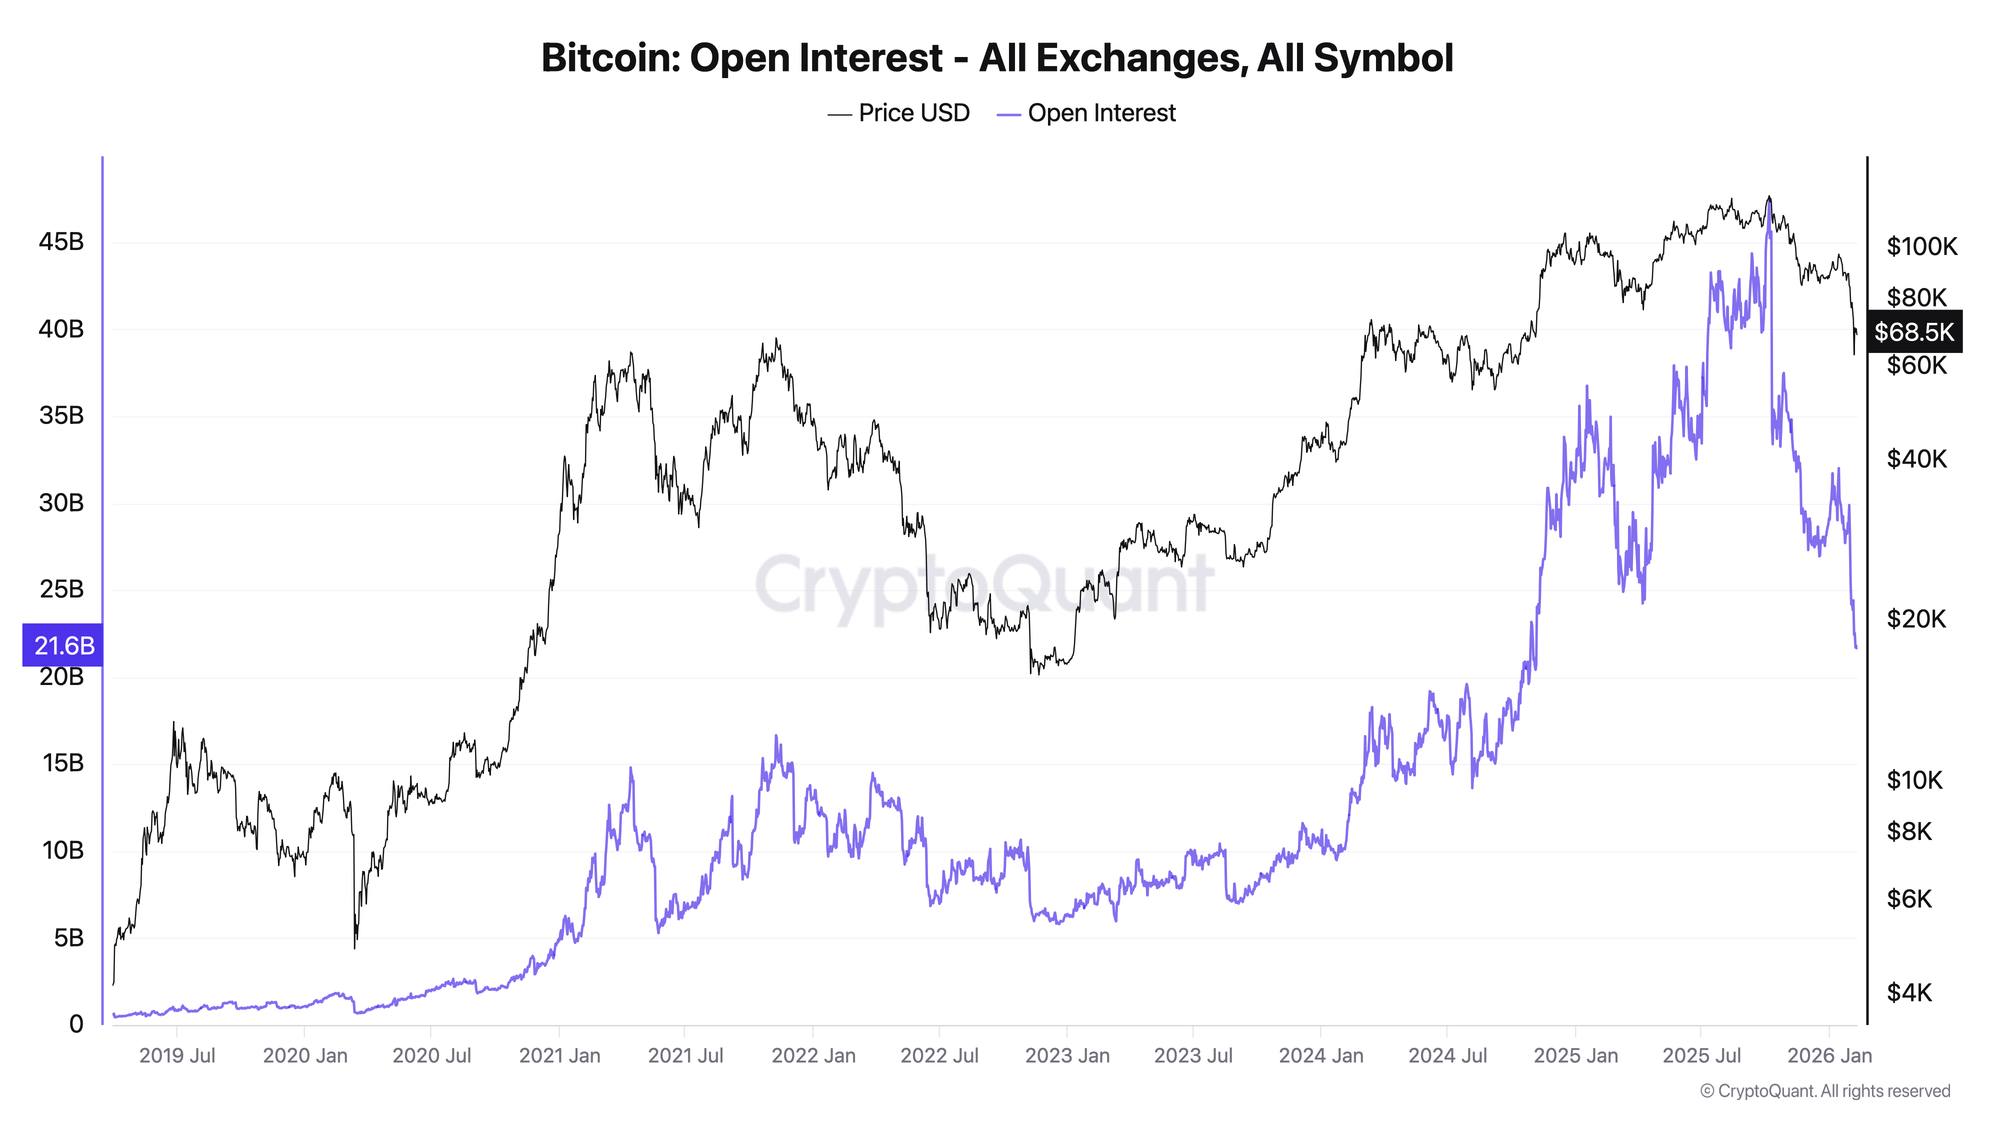
- Open Interest (OI) measures total USD value of outstanding Bitcoin futures/perpetual contracts across all exchanges.
- OI-Price divergence occurs when OI and price move in opposite directions - it signals a mismatch between positioning and price action.
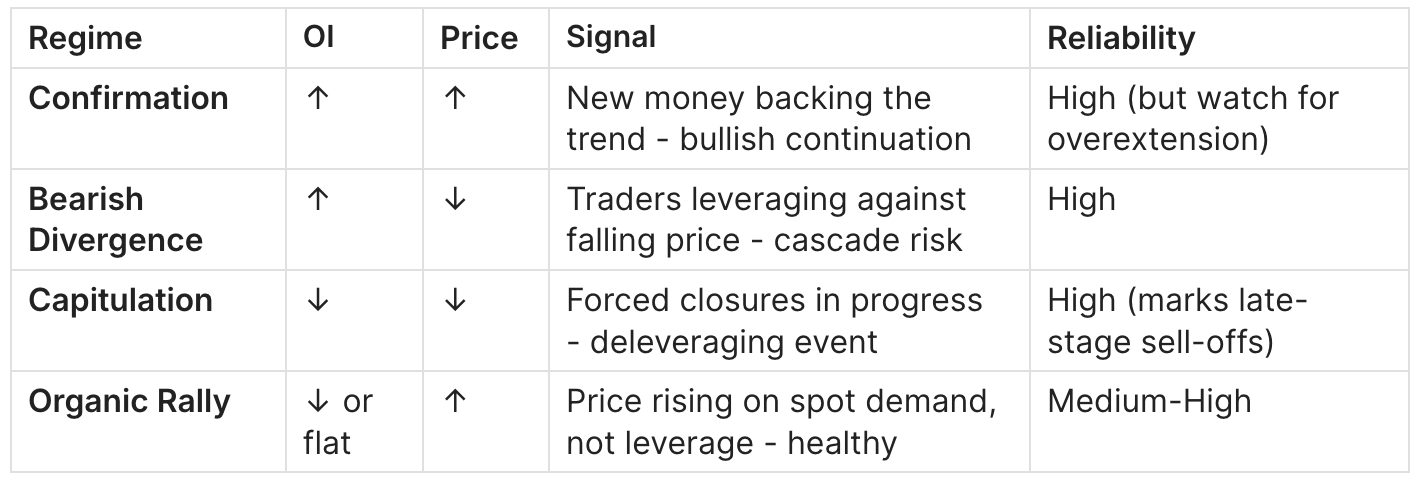
- 4 regimes exist: OI↑Price↑ (confirmation), OI↑Price↓ (bearish divergence), OI↓Price↓ (capitulation), OI↓Price↑ (organic rally).
- The most actionable signal: OI rising while price falls → traders are aggressively leveraging against the trend → liquidation cascade risk is elevated.
- False signals are common when OI changes are driven by basis arbitrage or coin-margined USD inflation rather than directional positioning.
- Signal rule: When 7-day OI change exceeds ±15% while price moves in the opposite direction by ≥5%, treat it as a high-conviction divergence.
The Signal Rule
The core framework maps two variables - OI direction and price direction - into four regimes:
Trigger thresholds:
A meaningful divergence requires magnitude on both sides. Minor OI fluctuations (±3%) with small price moves (±1%) are noise. The thresholds that have historically preceded actionable moves:
- 7-day OI change ≥ ±15% with 7-day price change in the opposite direction ≥ ±5%.
- OR 30-day OI change ≥ ±25% with 30-day price change in the opposite direction ≥ ±10%.
When these thresholds are met, the divergence is statistically likely to resolve within 7–21 days - either through a correction (if OI↑Price↓) or through trend acceleration (if OI↓Price↑).
Key Definitions
Open Interest (OI): Total USD notional value of all unsettled Bitcoin futures and perpetual swap contracts. Every open long has a matching short - OI counts both sides as one unit.
USD-denominated OI vs BTC-denominated OI: USD OI inflates mechanically when BTC price rises (same BTC position = more USD). BTC-denominated OI strips out this effect. Always check both.
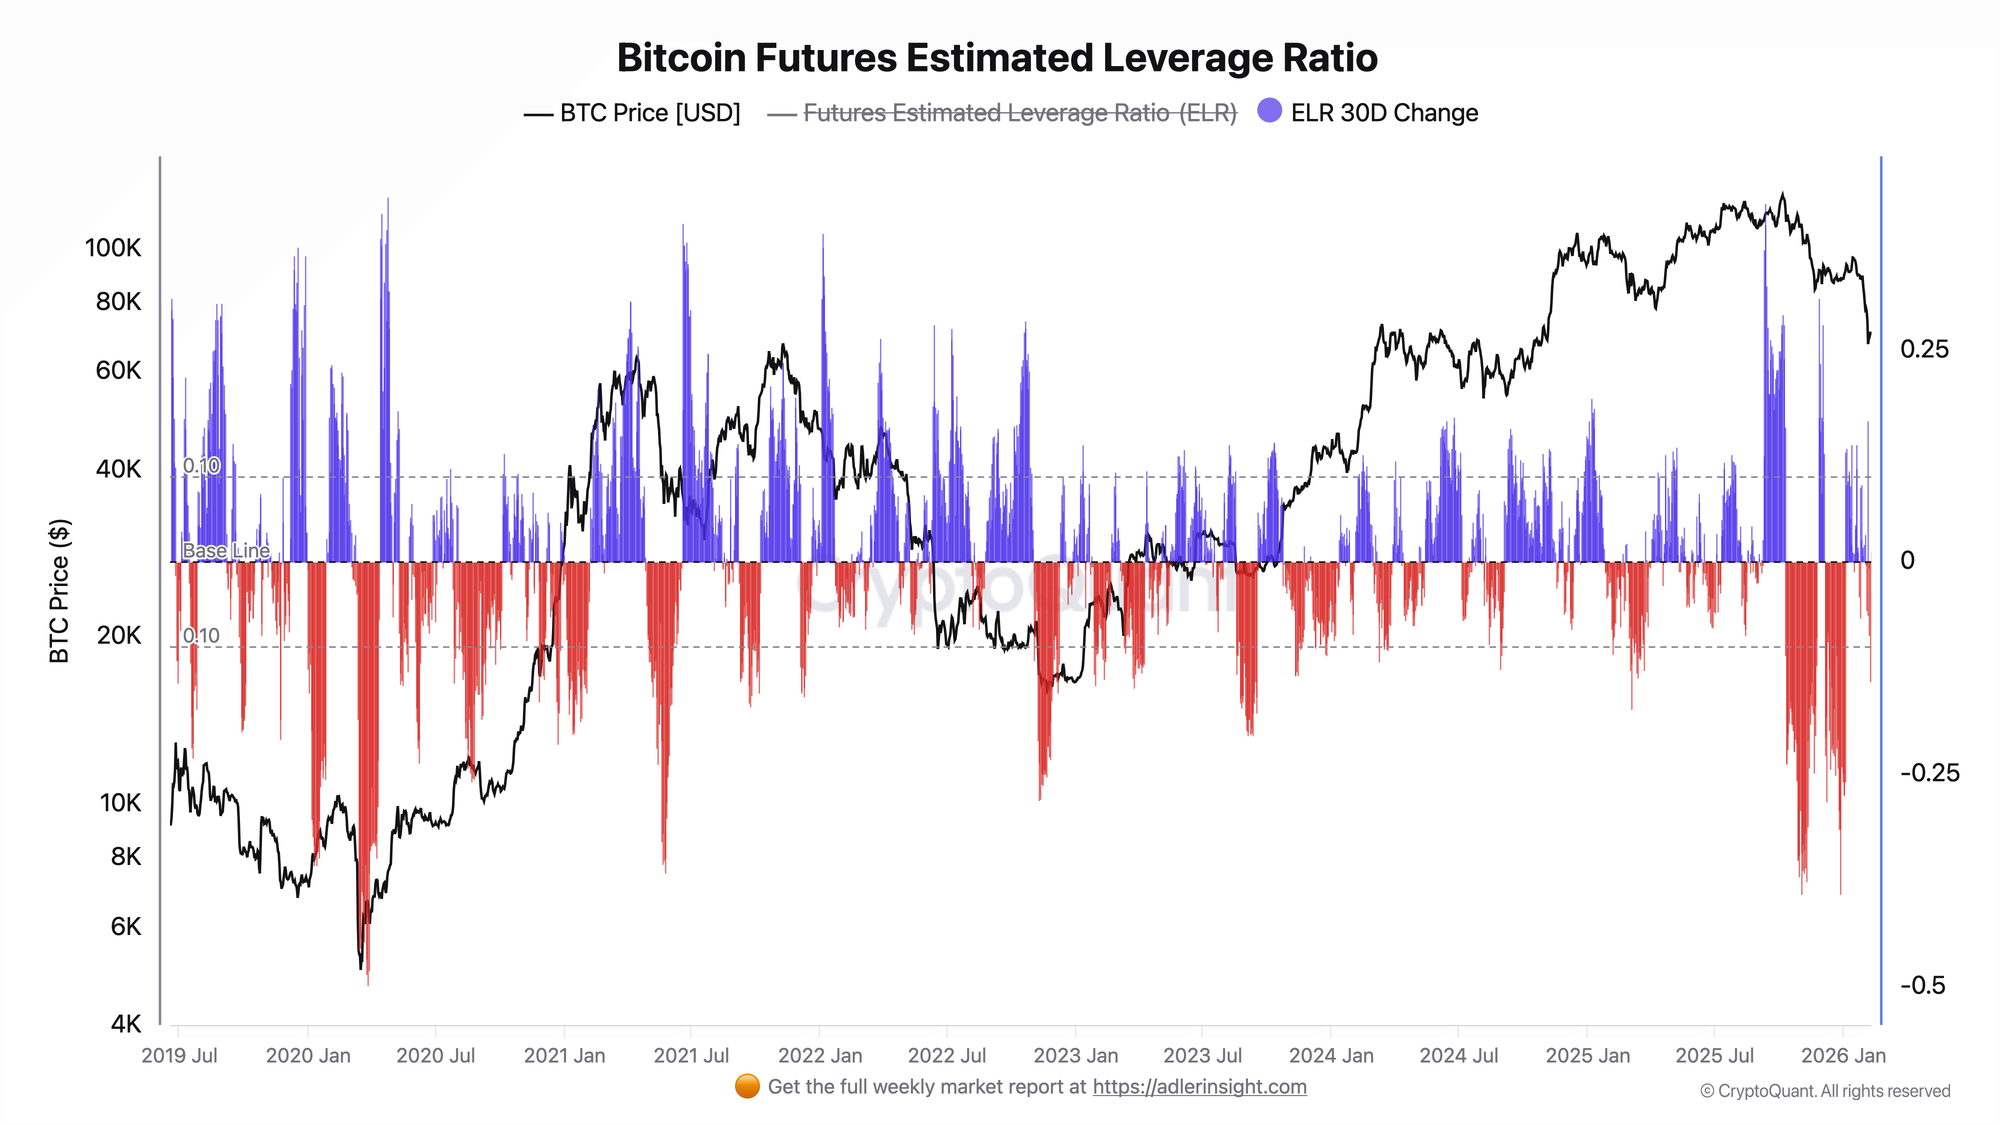
Estimated Leverage Ratio (ELR): OI ÷ Exchange Reserve. Adds a third dimension: not just "is positioning growing?" but "is positioning growing faster than the collateral backing it?"
Funding Rate: The periodic payment between longs and shorts on perpetual contracts. Positive = longs pay shorts (bullish crowding). Extreme funding amplifies divergence signals.
Deleveraging event: A sharp drop in OI (>15% in 48 hours) caused by forced liquidations, not voluntary closing. The hallmark of Regime 3 (capitulation).
How to Interpret Each Regime
Regime 1: OI Rising + Price Rising (Bullish Confirmation)
This is the "normal" bull market pattern. New capital enters derivative markets, traders open fresh long positions, and price rises on the back of increasing participation. It's the healthiest form of a rally because it's backed by actual capital deployment.
What to watch for: The signal turns dangerous when OI growth accelerates relative to price growth. If OI is up 50% while price is up 15%, the gap represents leverage overshoot - more positions are being opened than the price move justifies. This sets up a potential transition to Regime 3 (capitulation) on any reversal.
January–April 2021: OI climbed from $4.9B to $14.4B (+194%) while BTC rose from $29,286 to $63,567 (+117%). OI growth outpaced price growth by 77 percentage points. ELR rose from 0.27 to 0.35. The overshoot resolved violently: by May 19, OI had crashed from $14.4B to $6.0B as BTC fell 39%.
Key rule: Confirmation is healthy up to the point where OI/Price growth diverges. Once OI grows 1.5× faster than price over 30+ days, shift to defensive positioning.
Regime 2: OI Rising + Price Falling (Bearish Divergence)
This is the most dangerous divergence. When OI increases while price falls, it means traders are opening new positions into a declining market - typically leveraged longs "buying the dip" or aggressive shorts piling on. Either way, it increases the total liquidation exposure in the system.
Why it's dangerous: Rising OI during a decline means more positions exist at increasingly underwater levels. A further price drop will liquidate these positions, creating forced selling that accelerates the decline. It's the setup for a liquidation cascade.
June–November 2022 (Luna → FTX): After the Luna crash in June, OI dropped to $7.0B. Then something concerning happened: OI rebuilt from $7.0B back to $9.2B by November 1, even as BTC stayed flat-to-down ($19,371 → $20,505). ELR climbed from 0.45 to 0.57 - leverage was building on a shrinking reserve base. When FTX collapsed on November 9, OI dropped 26% to $6.8B, and BTC fell to $17,056. The bearish divergence resolved exactly as predicted: excess leverage was liquidated into a declining market.
Key rule: OI↑ during Price↓ is a liquidation cascade loading. The longer it persists, the more violent the eventual unwind.
Regime 3: OI Falling + Price Falling (Capitulation)
When both OI and price are declining simultaneously, the market is in active deleveraging. Positions are being forcibly closed (liquidations) or voluntarily closed (stop-losses, panic exits). This is the "flush" phase.
Why it matters: Capitulation is painful but cleansing. It removes the excess leverage that was built up in prior regimes. The depth of the OI drop indicates how complete the flush is. Historically, the deepest OI drops mark the best entry opportunities - once the leveraged players are gone, only conviction holders remain.
May 19–25, 2021: The single most dramatic deleveraging event in the data. OI crashed from $10.9B (May 10) to $5.6B (May 25) - a 49% drop in 15 days. BTC fell from $57,153 to $38,164 (-33%). ELR hit its all-time low of 0.193. This was the maximum possible deleveraging - and it preceded a rally from $29K to the $66K ATH by November.
Key rule: OI drops of >30% within 7 days signal capitulation. The lower the ELR post-event, the more complete the flush. ELR < 0.25 has historically been the strongest "all clear" signal for re-entry.
Regime 4: OI Flat/Falling + Price Rising (Organic Rally)
This is the most bullish regime, counterintuitively. When price rises without a corresponding increase in derivative leverage, the rally is driven by spot buying - actual demand for Bitcoin, not leveraged speculation. These rallies are harder to reverse because there's no leveraged overhang to unwind.
Why it's healthy: No leverage overhang means no liquidation cascade risk. The rally can sustain drawdowns of 10–15% without triggering forced selling. Corrections in Regime 4 are orderly, not cascading.
July–October 2021: After the May 2021 capitulation, BTC rallied from $29,822 (July 20) to $65,224 (October 20) - a 119% move. During this rally, OI was relatively flat: $7.0B → $15.3B, but the first leg (July to September) saw OI grow only modestly from $7.0B to $11.3B while price nearly doubled from $33K to $48K. ELR stayed low (0.28–0.32). The rally was spot-driven - healthy and sustainable until OI caught up in October and the cycle repeated.
Key rule: The best rallies start with low OI and low ELR. If price is rising and OI isn't keeping pace, stay long. The rally has room to run.
What Matters Most: Trend vs. Single Spike
A single day of OI-Price divergence is noise. The signal becomes reliable when the divergence persists for 3+ days (short-term) or 2+ weeks (macro). Brief OI spikes on event days (CPI, FOMC, expiry) are structural, not informational - they reverse within 24–48 hours.
Also critical: which timeframe you're analyzing. The same market can show Regime 1 on a 30-day view and Regime 2 on a 7-day view if the trend is reversing. When short-term and long-term regimes conflict, the short-term regime has more immediate predictive power but lower reliability.
Historical Examples
Example 1: The Perfect Bearish Divergence (Sep–Nov 2022)
Period: September 1 to November 9, 2022.
What OI showed: OI climbed from $8.4B to $9.2B (+9.5%) over two months while BTC drifted sideways-to-down ($19,988 → $20,505 → $17,056). ELR was consistently elevated: 0.52 → 0.57 → 0.50 post-crash.
What happened next: FTX collapsed. OI dropped 26% in three days. BTC fell 17%.
Why it worked: The ELR buildup was the critical confirmation. OI rising alone could be benign (arbitrage, hedging). OI rising with rising ELR means new leverage, not hedged positions. The combination correctly flagged systemic risk weeks before the catalyst appeared.
Key takeaway: Bearish divergence + rising ELR = high-conviction short-term risk signal.
Example 2: The Post-Capitulation Organic Rally (May–Oct 2021)
Period: May 25 to October 20, 2021.
What OI showed: After the May crash bottomed OI at $5.6B and ELR at 0.193, OI rebuilt slowly from $5.6B to $7.0B (June–July) while price recovered from $38K to $33K to $41K. OI growth lagged price growth by a wide margin - classic Regime 4.
What happened next: BTC rallied 119% from $29.8K to $65.2K. The rally was spot-driven for 3+ months before leverage caught up in October.
Why it worked: The May capitulation had purged all excess leverage. When price started rising, it was on the back of spot buyers and conviction holders - not leveraged speculators. This made the rally resilient to 20–30% drawdowns (the July 20 dip to $29.8K was absorbed without a cascade).
Key takeaway: ELR < 0.25 post-capitulation + price recovery with flat OI = highest-confidence entry signal in the framework.
Example 3: The ETF-Era Regime Shift (Jan–Mar 2024)
Period: January 10 to March 14, 2024.
What OI showed: OI surged from $10.3B to $18.3B (+78%) as BTC rallied from $46K to $71.7K (+56%). This looks like Regime 1 (confirmation), but ELR rose only modestly from 0.37 to 0.41 - suggesting the OI growth was backed by proportional reserve growth.
What happened next: BTC consolidated around $60K–$70K for five months. No cascade, no capitulation. The correction was a controlled 25% pullback, not a leveraged unwind.
Why it was different: Post-ETF OI includes significant non-directional basis trade OI (buy spot ETF, sell futures). This "passive" OI inflates the headline number without adding directional risk. The moderate ELR was the signal that this wasn't a dangerous buildup.
Key takeaway: In the ETF era, OI levels alone are misleading. ELR is the essential filter - it separates dangerous leveraged OI from benign arbitrage OI.
How to Use It in Practice
Setup
Monitor the 7-day rolling change in aggregate OI (CoinGlass or CryptoQuant) alongside 7-day BTC price change. Identify which of the four regimes currently applies. Note the current ELR level as context.
Trigger
For risk-off (defensive): OI 7-day change > +15% AND price 7-day change < -5% (Regime 2: Bearish Divergence). Additional conviction if ELR > 0.50.
For accumulation (offensive): OI 7-day change < -20% AND ELR < 0.30 (Regime 3 transitioning to Regime 4). Additional conviction if funding rate is near zero or negative.
Confirm
- Regime 2 confirmation: Funding rate persistently positive (>0.01% per 8h) during the divergence. This means longs are paying to hold positions that are losing money - maximum fragility.
- Regime 4 confirmation: Exchange spot inflows declining (not selling). ETF inflows positive. Funding rate neutral.
Invalidates When
- Regime 2 resolves peacefully: OI flattens or declines without a cascade, and price stabilizes. This happens when the divergence was driven by hedged/arbitrage positions, not directional bets.
- Regime 4 converts to Regime 1: OI starts catching up to price, ELR begins climbing above 0.45. The "organic" character is lost.
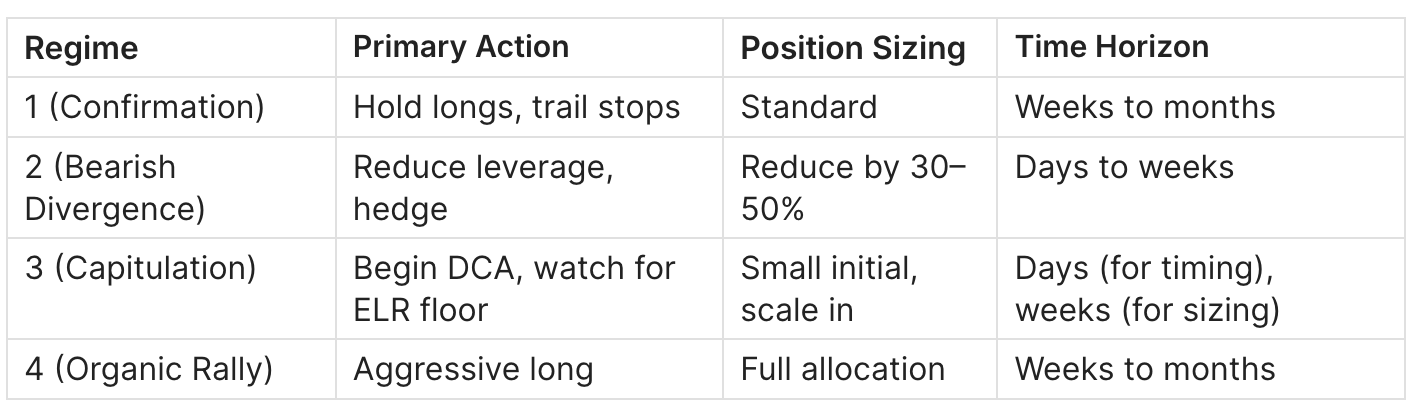
Action
Common Pitfalls
1. Confusing USD OI inflation with real positioning growth. When BTC price rises 20%, USD-denominated OI rises ~20% even if no new positions are opened. Always cross-check BTC-denominated OI. If BTC OI is flat while USD OI is rising, the "divergence" is just price math. Filter: Compare OI in BTC terms alongside USD terms. CoinGlass and Glassnode provide both.
2. Ignoring basis trade / arbitrage OI. Post-2024 ETF approval, a large portion of OI growth is cash-and-carry basis trades (buy spot ETF, sell perpetual). This OI is non-directional - it won't liquidate in a downturn. Treating it as bearish divergence creates false signals. Filter: Check ELR. If OI is rising but ELR is flat or declining, the new OI is likely well-collateralized (arbitrage). If ELR is rising alongside OI, it's leveraged and dangerous.
3. Using daily data for regime identification. Single-day OI spikes around CME expiry, FOMC days, or options settlement are structural noise. They reverse within 24–48 hours. Filter: Use 7-day rolling averages for OI and price, never spot values. The regime should persist for 3+ days to be actionable.
4. Treating Regime 1 as permanently safe. The transition from Regime 1 (confirmation) to Regime 3 (capitulation) can happen in hours. January–April 2021 was 14 weeks of Regime 1 followed by a 5-day crash that erased 53% of BTC value. Filter: Monitor the rate of OI growth vs. price growth. When OI accelerates while price decelerates, the regime is unstable regardless of both being positive.
5. Assuming Regime 2 resolves immediately. Bearish divergence (OI↑Price↓) can persist for weeks or months, as it did from July to November 2022. During that period, OI rebuilt and leverage accumulated for four months before the FTX trigger. Filter: Regime 2 is a risk signal, not a timing signal. Reduce exposure when it appears, but don't expect immediate resolution. Use funding rate extremes or sudden OI drops as the timing trigger.
6. Misreading Regime 4 (organic rally) as "low conviction." Traders accustomed to using OI as a momentum indicator may interpret flat OI during a rally as "weak." The opposite is true: flat OI with rising price is the healthiest setup because it means price is driven by actual demand, not leverage. Filter: Check where the buying is coming from - spot exchange flows, ETF inflows, or on-chain accumulation. If spot demand is visible, Regime 4 is strong regardless of OI.
OI-Price Divergence vs. Funding Rate Divergence vs. ELR Divergence
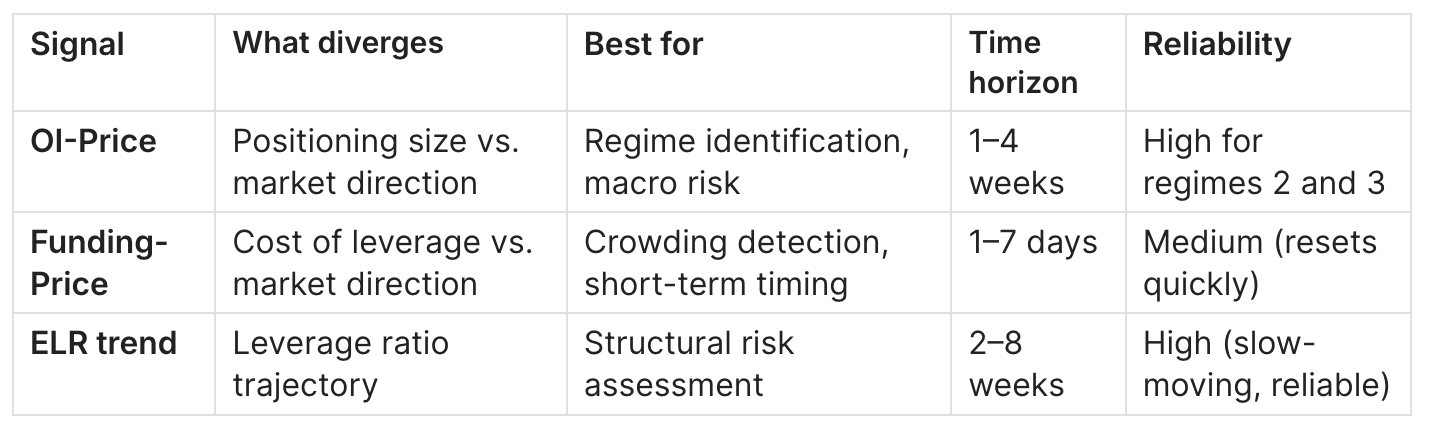
When to use which: OI-Price divergence tells you the regime. Funding-Price divergence tells you the timing within that regime. ELR trend tells you the structural risk level - is the regime dangerous or manageable?
The strongest signal combines all three: Regime 2 (OI↑Price↓) + extreme positive funding (>0.03%/8h) + ELR > 0.50. This triple confirmation has preceded every major crash in the dataset.
FAQ
What is a meaningful OI-Price divergence?
A divergence becomes actionable when OI changes ≥15% over 7 days while price moves ≥5% in the opposite direction. Smaller moves are typically noise from arbitrage rebalancing or expiry effects.
Where can I track OI vs. Price in real time?
CoinGlass overlays OI with price on the same chart. CryptoQuant provides OI alongside all derivative metrics. TradingView has community indicators that plot the divergence directly.
Does OI-Price divergence still work after the ETF era?
Yes, but with a critical caveat: ETF-era OI includes significant non-directional basis trade volume. Filter using ELR - if ELR is stable despite OI growth, the new OI is likely arbitrage, not leveraged speculation.
Which regime is the best entry signal?
Regime 3 (capitulation) transitioning to Regime 4 (organic rally) is historically the highest-conviction entry. The May 2021 post-crash (ELR 0.19, OI $5.6B) preceded a 119% rally. Look for ELR < 0.30 and OI having dropped 30%+ from its recent peak.
Can this framework be used for altcoins?
Yes. Altcoin derivative markets are thinner, making the divergence signals even more pronounced. However, altcoin OI data is less reliable (fewer aggregators, more exchange-specific distortions), so use wider thresholds.
How fast do divergences resolve?
Regime 2 (bearish divergence) typically resolves within 7–21 days of reaching extreme levels, but can persist for months in a slow-bleed bear market. Regime 3 (capitulation) resolves in 1–5 days - it's the fastest. Regime 4 (organic rally) can persist for months.
What if OI and price are both flat?
Flat OI + flat price = Regime 0 (consolidation). Low volatility, no signal. Wait for either variable to break the range. These periods often precede explosive moves in either direction.
Is coin-margined or USDT-margined OI more important?
USDT-margined (linear) OI is a cleaner read because it doesn't inflate with price. Coin-margined OI adds reflexivity: as price rises, existing positions become worth more in USD, which can trigger additional margin calls on any reversal. Monitor both, but trust linear OI for divergence analysis.
Related Guides
- Bitcoin Open Interest & Leverage Ratio: Definition, Formula & Cycle Signals - The comprehensive pillar covering OI and ELR fundamentals, calculation, and zone tables.
- Bitcoin Liquidation Cascade: How It Works & How to Predict It - What happens when Regime 2 (bearish divergence) resolves violently.
- Bitcoin Funding Rate Guide - How funding rate confirms or contradicts OI-Price divergence signals.
- Bitcoin Exchange Flows - On-chain data for confirming whether Regime 4 (organic rally) is spot-driven.
- MVRV Ratio Guide - Spot-market valuation complement for regime context.
Conclusion
- Four OI-Price regimes cover every market condition. Identifying which regime is active is the first step in any derivatives-informed strategy.
- Bearish divergence (OI↑Price↓) is the most actionable signal - it flags liquidation cascade risk before the cascade happens.
- ELR is the essential third variable: it separates dangerous leveraged OI from benign arbitrage OI, especially in the post-ETF market.
Next step: Read the Liquidation Cascade guide to understand what happens when Regime 2 divergences resolve - and how to position ahead of them.