
The Puell Multiple measures how much Bitcoin miners are earning today compared to their yearly average, revealing whether the market is overheated or undervalued from a supply-side perspective. This miner profitability oscillator has historically identified every major Bitcoin cycle top and bottom since 2011, making it one of the most reliable long-term valuation tools for strategic investors.
TL;DR
- What it measures: Ratio of daily miner revenue (USD) to 365-day average - shows miner profitability vs. historical norm
- Key thresholds: Green zone < 0.5 (accumulation), Neutral 0.5–3.0, Red zone > 3.0 (distribution) - thresholds decline each halving epoch
- Best use case: Identifying macro cycle tops and bottoms, timing strategic entries/exits
- Main limitation: Lagging indicator, doesn't account for demand-side factors, halving events cause immediate 50% drop
- Combine with: Hash Ribbons for capitulation confirmation, Miner Reserve & Outflow for real-time selling pressure, MVRV Z-Score for demand-side validation
Table of Contents
- What Is the Puell Multiple?
- Formula
- Data Sources
- How the Puell Multiple Is Calculated
- How to Interpret Puell Multiple Values
- Historical Cycle Examples
- Practical Application
- Puell Multiple vs. Hash Ribbons vs. MVRV Z-Score
- How Puell Multiple Relates to Other Indicators
- Puell Multiple Limitations
- FAQ
What Is the Puell Multiple?
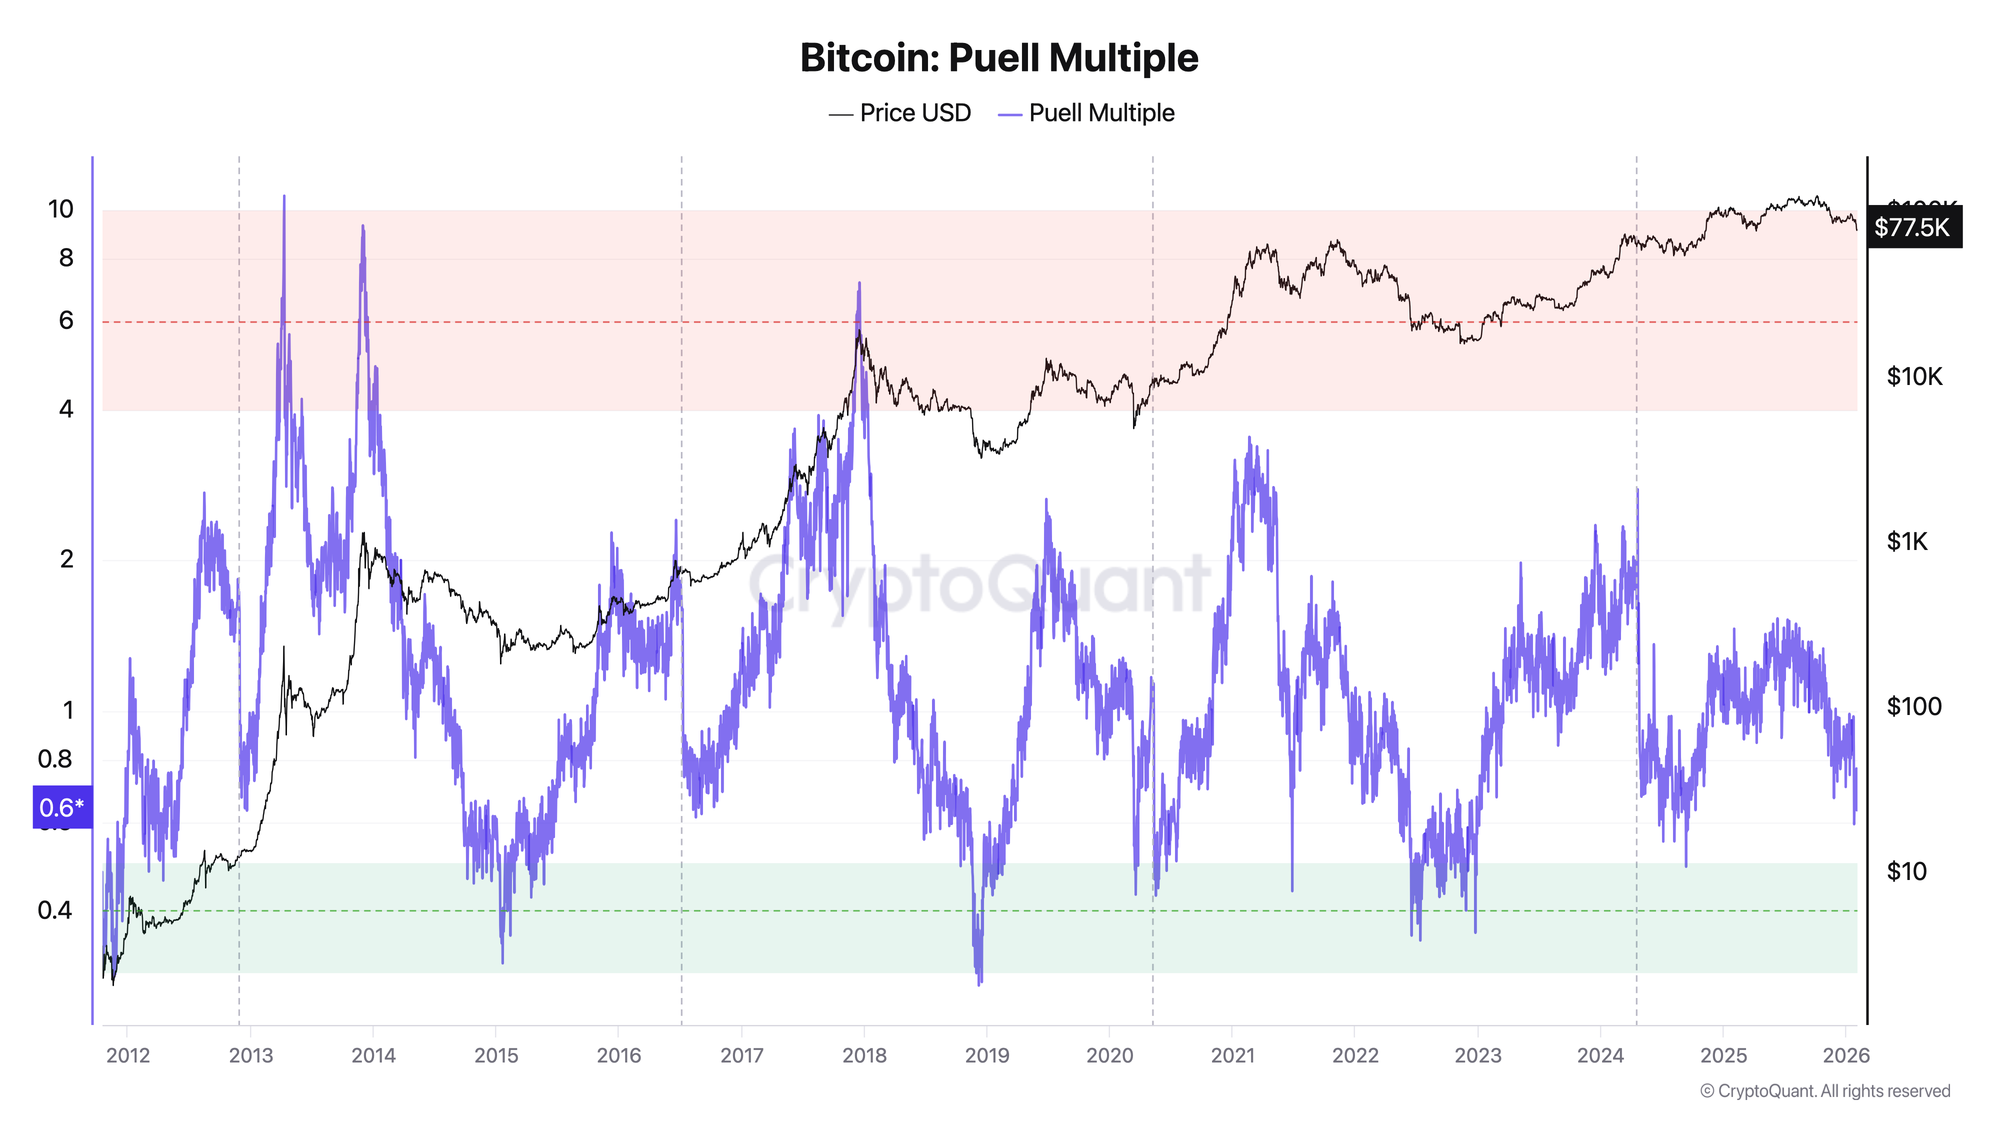
The Puell Multiple is an on-chain oscillator that evaluates Bitcoin's market cycles through the lens of miner economics. It compares the USD value of newly mined bitcoins each day against the yearly average of that same metric, producing a ratio that oscillates around the value of 1.0.
Bitcoin miners are often called "compulsory sellers" because they must sell a portion of their mining rewards to cover operational costs - electricity, hardware, facilities, and staff. When the Puell Multiple is high, miners are earning significantly more than usual, which creates an incentive to sell aggressively. When it's low, miners face income stress, leading weaker operations to shut down and reducing overall selling pressure.
In one line: The Puell Multiple tells you whether miners are making extraordinary profits (bearish for price) or struggling to survive (bullish for price).
The indicator was created by David Puell in March 2019. Puell is also the co-creator of the MVRV (Market Value to Realized Value) ratio, another foundational on-chain metric.
Formula
Puell Multiple = Daily Coin Issuance (USD) ÷ MA₃₆₅(Daily Coin Issuance USD)
Where:
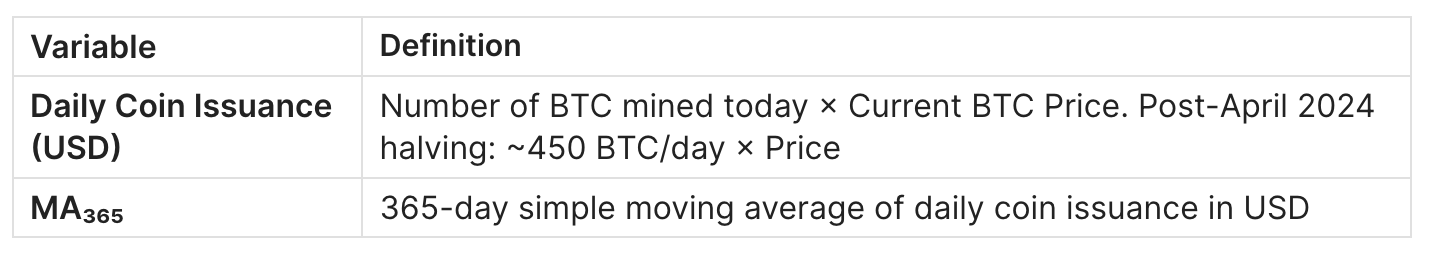
Note on Block Rewards:
- Pre-2012: 50 BTC per block (~7,200 BTC/day)
- 2012–2016: 25 BTC per block (~3,600 BTC/day)
- 2016–2020: 12.5 BTC per block (~1,800 BTC/day)
- 2020–2024: 6.25 BTC per block (~900 BTC/day)
- 2024–2028: 3.125 BTC per block (~450 BTC/day)
Data Sources
Glassnode | Paid/Free tier | Professional analysis, API exports | Freemium
CryptoQuant | Paid/Free tier | Real-time alerts, SQL queries | Freemium
Bitcoin Magazine Pro | Free | Interactive charting, visual zones | Free
CoinGlass | Free | Quick reference, derivatives context | Free
Newhedge | Free | Simple visualization | Free
TradingView | Free/Paid | Custom scripting, overlay with price | Freemium
Recommendation: Use Glassnode or CryptoQuant for data exports and backtesting; Bitcoin Magazine Pro for quick visual assessment.
How the Puell Multiple Is Calculated
Step 1: Calculate Daily Issuance Value
Multiply the number of bitcoins mined in a day by the closing price of that day.
Daily Issuance Value = BTC Mined Today × BTC Price (USD)
Example (January 2026):
- BTC mined: 450 BTC
- BTC price: $100,000
- Daily Issuance Value = 450 × $100,000 = $45,000,000
Step 2: Calculate 365-Day Moving Average
Sum the daily issuance values for the past 365 days and divide by 365.
MA₃₆₅ = Σ(Daily Issuance Value for past 365 days) ÷ 365
Example:
- If average daily issuance over past year = $40,000,000
- MA₃₆₅ = $40,000,000
Step 3: Compute the Ratio
Divide today's issuance value by the 365-day average.
Puell Multiple = $45,000,000 ÷ $40,000,000 = 1.125
Process Visualization
┌─────────────────────────────────────────────────────────────────┐
│                    PUELL MULTIPLE CALCULATION                   │
├─────────────────────────────────────────────────────────────────┤
│                                                                 │
│   Daily BTC Mined ──┐                                           │
│   (450 BTC)         │                                           │
│                     ├──► Daily Issuance (USD) ──┐               │
│   BTC Price ────────┘    ($45,000,000)          │               │
│   ($100,000)                                    │               │
│                                                 ├──► RATIO      │
│   Past 365 Days ────► MA₃₆₅ ────────────────────┘    (1.125)    │
│   Issuance History     ($40,000,000)                            │
│                                                                 │
│   OUTPUT: Puell Multiple = 1.125 (Neutral Zone)                 │
│                                                                 │
└─────────────────────────────────────────────────────────────────┘
How to Interpret Puell Multiple Values
Zone Table
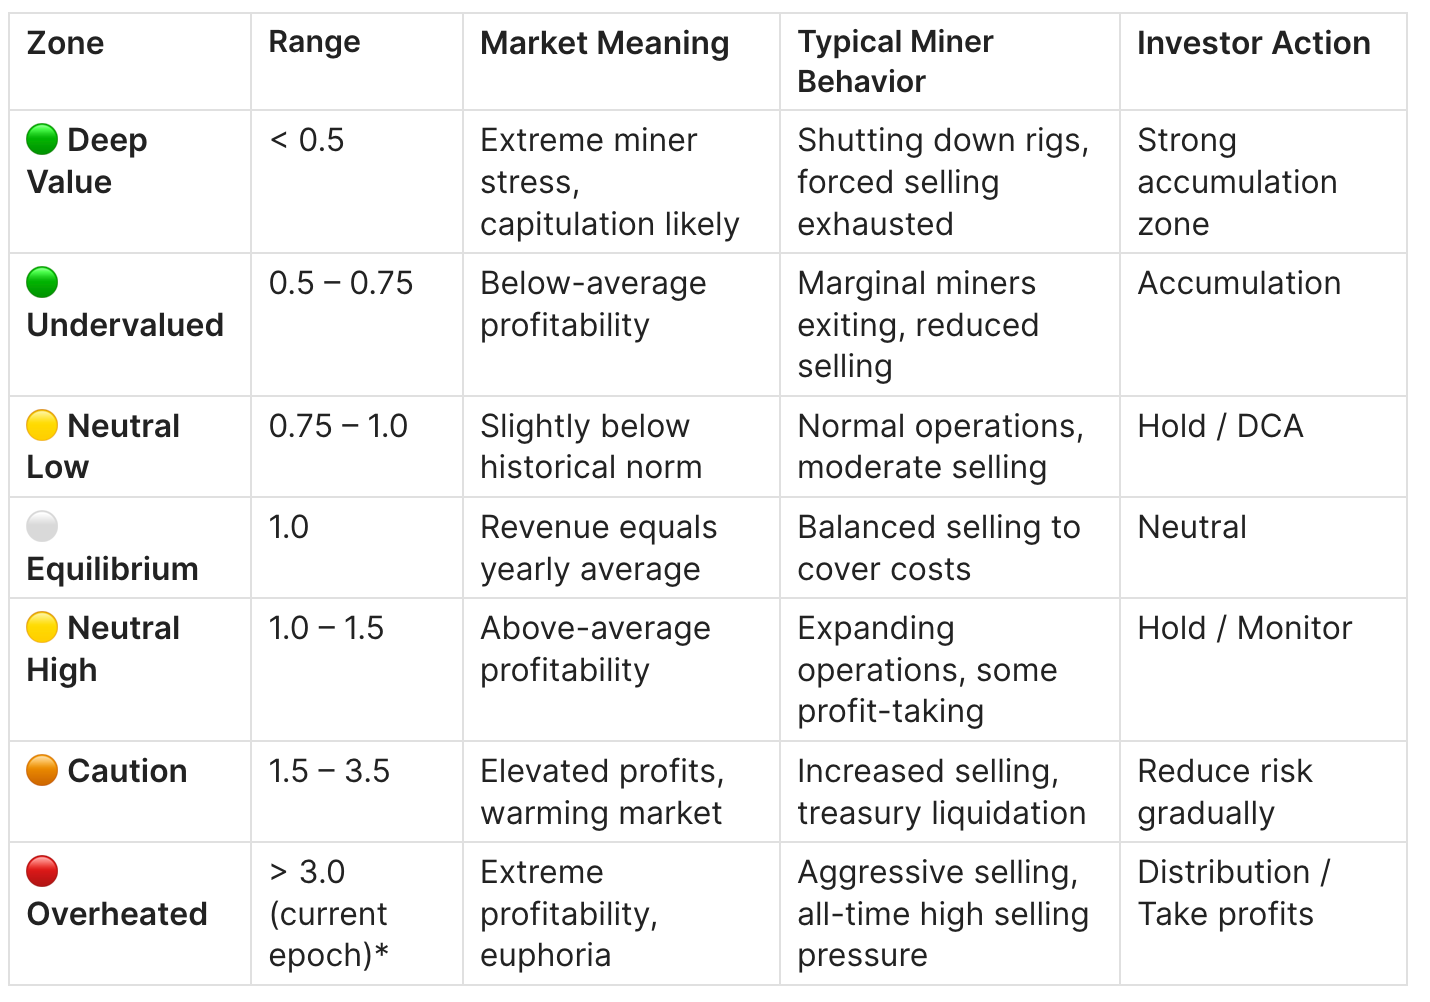
*Note: The red zone threshold declines with each halving epoch. Historical thresholds: 2013 epoch (>8), 2017 epoch (>5), 2021+ epoch (>3).
Puell Multiple > 3.0 (Red Zone - Current Epoch)
What it means: Miners are earning 3× their yearly average or more. This level of profitability is unsustainable and has historically preceded major cycle tops. Note: The actual threshold has declined with each halving (was >8 in 2013, >5 in 2017).
What you typically see:
- Rapid price appreciation (parabolic moves)
- Social media euphoria and mainstream media coverage
- Miners aggressively liquidating treasuries
- Hash rate expanding as new miners enter
Typical mistakes:
- Assuming "this time is different"
- Ignoring the signal because price is still rising
- Waiting for exact top (the signal is early by design)
Historical peaks:
- 2013 (April): 10.68 (all-time high)
- 2013 (November): 9.32
- 2017 (December): 7.17
- 2021 (February): 3.53
Puell Multiple < 0.5 (Green Zone)
What it means: Miners are earning less than half their yearly average. Many operations become unprofitable, forcing weaker miners to capitulate.
What you typically see:
- Extended bear market conditions
- Negative sentiment, capitulation headlines
- Hash rate declining as miners shut down
- Difficulty adjustments trending down
Typical mistakes:
- Selling into the bottom out of fear
- Waiting for "one more leg down"
- Not recognizing miner capitulation as opportunity
Historical bottoms:
- 2011 (November): 0.29
- 2015 (January): 0.31
- 2018 (December): 0.28
- 2020 (COVID crash): 0.43
- 2022 (July): 0.35
Puell Multiple = 1.0 (Equilibrium)
The equilibrium level indicates that current miner revenue matches the yearly average - neither overheated nor stressed. This is a neutral reading that requires other indicators for directional bias.
Bitcoin Puell Multiple Current Value: How to Read It Now
The Puell Multiple is dynamic — it changes daily as BTC price
and miner revenue fluctuate. To find the current value, check
Bitcoin Magazine Pro, CryptoQuant, or Glassnode.
How to interpret any current reading:
Below 0.5 - Miners are earning less than half their yearly
average. Historically the best zone for long-term accumulation.
Confirm with Hash Ribbons Buy signal.
0.5–1.0 - Post-halving normalization or early recovery.
Neutral-low zone. DCA approach appropriate.
1.0–2.0 - Healthy bull market range. Miners earning at or
above average. Maintain positions, no urgency.
2.0–3.0 - Elevated profitability. Begin monitoring for
distribution signals. Reduce marginal exposure.
Above 3.0 - Red zone in current halving epoch. Historically
precedes major corrections. Scale out with confirmation from
MVRV Z-Score and Miner Reserve Outflow.
As of early 2026, Puell Multiple has been oscillating in the
0.6–1.0 range - post-halving normalization phase, not yet
signaling overheating.
Historical Cycle Examples
Example 1: 2013 Double Top
Situation: Bitcoin experienced two major peaks in 2013 - April ($260) and November ($1,150).
Metric behavior:
- April 10, 2013: Puell Multiple reached 10.68, the highest reading ever recorded
- November 30, 2013: Puell Multiple rose to 9.32 before the final blow-off top
Price behavior:
- April peak: $260 → crashed 75% to $65
- November peak: $1,150 → crashed 85% to $170 over next year
Conclusion:
- Puell Multiple flagged both tops with extreme readings > 9.0
- The indicator signaled ~1 week before the April crash
- Confirmed: extreme miner profitability precedes distribution
Example 2: 2015 Bear Market Bottom
Situation: After the 2013 bubble burst, Bitcoin entered a prolonged bear market lasting ~400 days.
Metric behavior:
- Puell Multiple dropped below 0.5 in late 2014
- Reached lowest point of 0.31 on January 20, 2015
- Remained in green zone until mid-2015
Price behavior:
- Price bottomed at $165 in January 2015
- Sideways accumulation for 10 months
- Bull market began Q4 2015
Conclusion:
- Green zone signal lasted ~10 months - patience required
- Accumulation during this period yielded 100× returns to 2017 peak
- Miner capitulation (hash rate decline) coincided with Puell green zone
Example 3: 2017 Bull Market Top
Situation: Bitcoin's first mainstream cycle, reaching ~$20,000 in December 2017.
Metric behavior:
- Puell Multiple entered caution zone (>1.5) in May 2017 at ~$2,000
- Reached red zone peak of 7.17 on December 17, 2017
- Signal came when price was around $17,000–$19,000
Price behavior:
- Price reached ATH of $19,800 on December 17
- Crashed 84% to $3,200 over the next year
- Peak Puell coincided almost exactly with price ATH
Conclusion:
- Signal appeared ~2-3 weeks before the absolute top
- Even selling at the red zone signal ($11,000-$15,000) captured majority of gains
- Demonstrates Puell Multiple is early but reliable
Example 4: 2021 Cycle & ETF Era (2024–2025)
Situation: Complex cycle with double-top in 2021 and ETF-driven rally in 2024–2025.
Metric behavior:
- February 19, 2021: Puell Multiple reached cycle high of 3.53 (BTC ~$56,000)
- April 2021: Puell at 3.32 during $64,000 ATH
- November 2021: Notably lower Puell reading of ~1.58 at higher price ($69,000) - bearish divergence
- April 2024 halving: Immediate drop from ~1.6 to ~0.73
- Q4 2025–Q1 2026: Puell oscillating in 0.6–1.0 range
Price behavior:
- 2021 cycle: $64K → $29K → $69K → $15.5K bear bottom
- 2024 halving created artificial suppression
- ETF inflows absorbing miner selling pressure
Conclusion:
- Post-halving readings require 365-day adjustment period
- ETF era adds demand-side variable not captured by Puell
- Bearish divergence in 2021: Puell dropped from 3.53 to 1.58 while price rose from $56K to $69K - warned of weak underlying support
- Current cycle: Puell at 0.6–1.0 suggests still in post-halving normalization, not yet overheated
Practical Application
Buy / Accumulation Conditions
Signal: Puell Multiple < 0.5 (green zone entry)
Confirmation conditions:
- Hash Ribbons showing "Buy" signal (30DMA > 60DMA after capitulation)
- Miner Reserve stabilizing or increasing (selling pressure exhausted)
- MVRV Z-Score < 0 (market value below realized value)
Common traps:
- Green zone can persist for months - don't expect immediate reversal
- Post-halving green zones are artificial (wait 60–90 days)
- Macro events (COVID, regulatory) can extend green zones
Risk guidance:
- Scale into position over 2–4 months during green zone
- Allocate 30–50% of intended position on first green zone entry
- Add remaining on Hash Ribbons "Buy" confirmation
Risk-Off / Distribution Conditions
Signal: Puell Multiple > 3.0 (in current post-2020 epoch)
Confirmation conditions:
- MVRV Z-Score > 5 (extreme overvaluation)
- Miner Outflow increasing significantly (treasury liquidation)
- STH (Short-Term Holder) NUPL > 0.4 (euphoria)
Common traps:
- Price often continues higher after red zone entry
- Waiting for "perfect top" - signal is early by design
- Assuming linear price targets from Puell levels
Risk guidance:
- Begin scaling out at Puell > 2.0 (gradual profit-taking)
- Reduce exposure by 50% at Puell > 3.0
- Consider full exit only with multiple confirmations
- Never sell 100% - asymmetric upside in crypto
Neutral / Wait Conditions
Signal: Puell Multiple between 0.75 and 2.0
What to do:
- Maintain existing positions
- Use DCA (Dollar Cost Averaging) strategy
- Monitor for directional breakout
- Focus on other indicators for short-term signals
Key levels to watch:
- Break below 0.5: Initiate accumulation protocol
Break above 2.0: Initiate distribution protocol (begin scaling out)
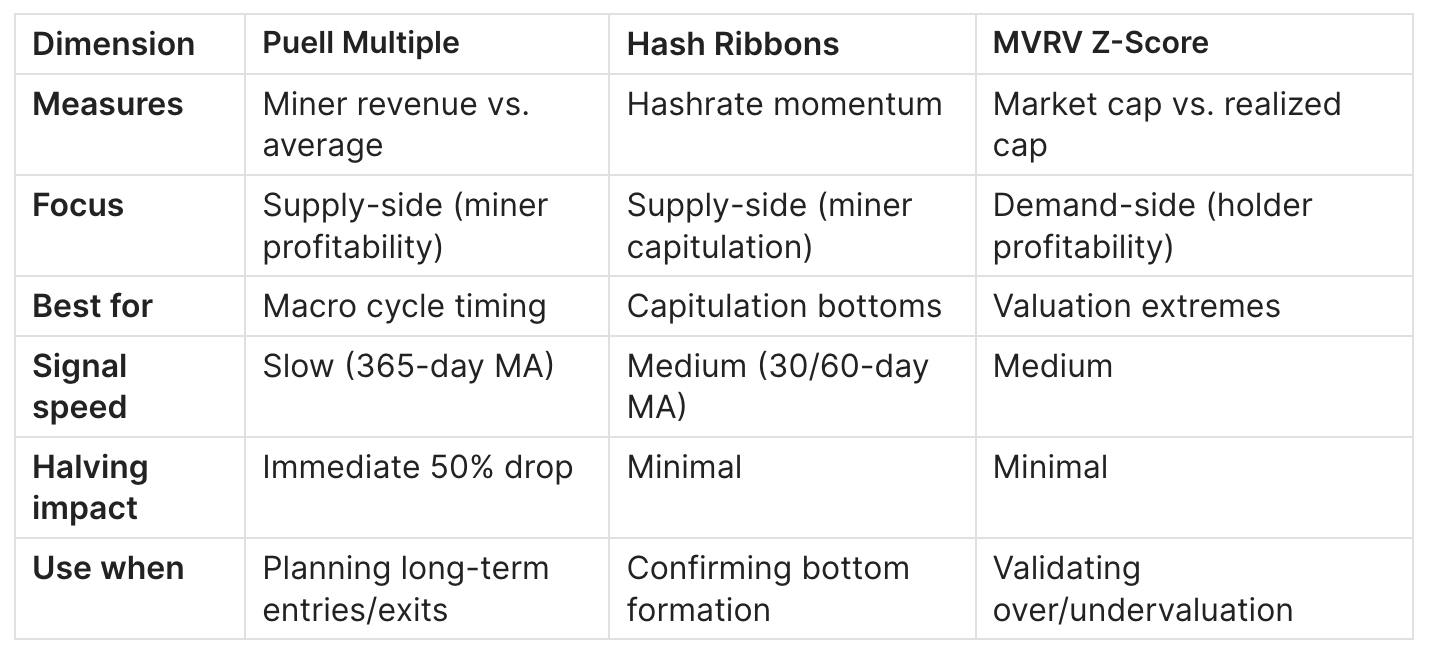
Puell Multiple vs. Hash Ribbons vs. MVRV Z-Score
Combined Analysis Recipe
Bottom Formation Protocol:
- Puell Multiple enters green zone (< 0.5)
- Wait for Hash Ribbons "Buy" signal
- Confirm MVRV Z-Score < 0
- Execute accumulation
Top Formation Protocol:
- Puell Multiple enters red zone (> 3.0 in current epoch)
- MVRV Z-Score > 5
- Miner Reserve declining rapidly
- Execute distribution
How Puell Multiple Relates to Other Indicators
Mathematical Bridges
Puell Multiple ↔ Miner Revenue:
Puell Multiple = (Daily Miner Revenue) ÷ (365-day Average Miner Revenue)
Miner Revenue ↔ Hash Price:
Hash Price = Daily Miner Revenue ÷ Network Hashrate
Puell Multiple × Average Revenue = Current Revenue = Hash Price × Hashrate
Puell Multiple ↔ Production Cost: When Puell < 0.5, the implied BTC price approaches or falls below average production cost, creating a natural price floor.
Internal Indicator Links
- Bitcoin Supply in Profit: Definition, Thresholds & Market Signals
- Bitcoin STH SOPR: What It Is and How to Use It
- MVRV Z-Score: Demand-side validation
- Realized Profit vs Unrealized Profit: What's the Difference
Puell Multiple Limitations
1. Halving Distortion
When it fails: Immediately after Bitcoin halving events
Why: The numerator (daily issuance value) drops by 50% overnight while the denominator (365-day average) still reflects pre-halving values. This creates an artificial green zone for ~6–12 months.
Solution:
- Discount green zone readings for 90–180 days post-halving
- Use Hash Ribbons as primary signal during halving adjustment period
- Monitor the ratio's trajectory rather than absolute level
2. Demand-Side Blindness
When it fails: When unprecedented demand (ETFs, corporate treasuries) absorbs miner selling
Why: Puell only measures supply-side dynamics. Strong demand can sustain high Puell readings longer than historical patterns suggest.
Solution:
- Combine with MVRV Z-Score (demand indicator)
- Monitor ETF flows and corporate accumulation data
- Adjust thresholds during structural demand shifts
3. Transaction Fee Exclusion
When it fails: During periods of high transaction fee revenue (Ordinals, BRC-20 activity)
Why: Classic Puell formula uses only block subsidy, not total miner revenue including fees. In high-fee environments, miners are more profitable than Puell suggests.
Solution:
- Use "Total Revenue Puell Multiple" variant where available
- Monitor fee/subsidy ratio separately
- Glassnode and CryptoQuant offer fee-inclusive variants
4. Early Signaling
When it fails: When precision timing is required
Why: By design, Puell signals cycle extremes early. Red zone can appear weeks before top, green zone can persist for months.
Solution:
- Use Puell for strategic allocation, not tactical trading
- Layer with faster indicators (Hash Ribbons, SOPR) for entry timing
- Accept that Puell is a zone indicator, not a point indicator
FAQ
What is the Puell Multiple?
The Puell Multiple is an on-chain indicator that compares Bitcoin miners' current daily revenue (in USD) to their 365-day moving average revenue. It produces a ratio that oscillates based on miner profitability relative to historical norms. Values below 0.5 indicate miner stress and potential buying opportunities; values above 3.5 indicate excessive profitability and potential selling opportunities.
Where can I find Puell Multiple data?
Free options include Bitcoin Magazine Pro, CoinGlass, Newhedge, and TradingView (community scripts). For professional analysis with API access and historical exports, Glassnode and CryptoQuant offer comprehensive data packages.
What is the current Puell Multiple reading?
Check live charts at Bitcoin Magazine Pro or CryptoQuant. As of early 2026, the indicator has been oscillating in the 0.6–1.0 range, reflecting post-halving normalization. This suggests a "Neutral Low" to "Neutral" zone - neither overheated nor in deep capitulation.
Why does the Puell Multiple drop after halving?
Because the halving cuts block rewards in half, the daily issuance value (numerator) drops immediately by 50%, while the 365-day average (denominator) still includes pre-halving values. This creates an artificial low reading that takes ~12 months to normalize.
Can the Puell Multiple be used for altcoins?
Technically, yes - any Proof-of-Work coin with predictable issuance can have a Puell Multiple calculated. However, the indicator is most reliable for Bitcoin due to its longer history, more stable monetary policy, and deeper liquidity. For altcoins, sample sizes are smaller and the metric is less tested.
How reliable is the Puell Multiple?
The Puell Multiple has correctly identified every major Bitcoin cycle top and bottom since 2011. However, it is a lagging, slow-moving indicator that signals early. It should not be used for short-term trading but is highly reliable for strategic positioning over multi-month timeframes.
What's the difference between Puell Multiple and Hash Ribbons?
Puell Multiple measures miner profitability (revenue vs. average). Hash Ribbons measure miner capitulation (hashrate momentum). They complement each other: Puell shows whether miners should be stressed; Hash Ribbons show whether they are actually shutting down. Use both together for highest conviction signals.
Why is the Puell Multiple upper band declining over time?
Each halving reduces the maximum potential Puell Multiple because it caps the numerator's growth while the denominator reflects higher historical prices. In 2013, Puell reached 10.68; in 2017, 7.17; by 2021, only 3.53. Some analysts now use a dynamic declining upper band starting at ~10 in 2013, declining roughly 30–50% each halving epoch. Conservative investors begin reducing exposure when Puell exceeds 2.5–3.0 in current epoch.
What Puell Multiple level signals a market top?
Historically, readings in the "red zone" have coincided with macro cycle tops, but the threshold declines each halving epoch: 2013 epoch peaked at 10.68, 2017 at 7.17, and 2021 at 3.53. For the current post-2024 halving epoch, readings above 2.5–3.0 warrant caution. Conservative investors begin reducing exposure when Puell exceeds 2.0.
How should I combine Puell Multiple with other indicators?
For bottoms: Wait for Puell < 0.5 AND Hash Ribbons "Buy" signal AND MVRV Z-Score < 0. For tops: Look for Puell > 3.5 AND MVRV Z-Score > 5 AND increasing Miner Outflows. The confluence of multiple indicators dramatically increases signal reliability.
Does the Puell Multiple account for transaction fees?
The classic formula uses only block subsidies, not transaction fees. During periods of high fee activity (like Ordinals inscriptions), miners earn more than Puell indicates. Some data providers offer "Total Revenue" variants that include fees - check Glassnode for this option.
What should I do when Puell Multiple is in the neutral zone?
When Puell is between 0.75 and 2.5, it provides no strong directional signal. Maintain existing positions, use DCA for new accumulation, and rely on other indicators (momentum, sentiment, macro) for near-term decisions.
Conclusion
- The Puell Multiple is a supply-side oscillator measuring miner profitability relative to the 365-day average
- Green zone (< 0.5) = miner capitulation, historically excellent buying opportunities
- Red zone (> 3.5) = excessive profitability, historically precedes major corrections
- Post-halving readings require 90–180 day adjustment period
- Combine with Hash Ribbons (capitulation timing) and MVRV Z-Score (demand validation) for highest conviction
- Use as strategic positioning tool, not short-term trading signal
Related Indicators in the Miner Economics
- Bitcoin Hash Ribbons: Definition & Capitulation Signals - Hashrate-based miner capitulation and recovery indicator
- Miner Reserve & Outflow: Tracking Selling Pressure - Real-time miner selling behavior tracking
Data & Tools
Daily On-Chain Analysis: Adler AM - Free weekly Bitcoin analytics
Premium Research: Adler Premium - Institutional-grade on-chain reports
Interactive Charts: CryptoQuant | Glassnode
Disclaimer: This content is for educational purposes only and does not constitute financial advice. Always conduct your own research before making investment decisions.