
Short-Term Holder Realized Price is the single most-watched cost basis level on-chain - the price at which recent Bitcoin buyers collectively break even. When BTC trades above it, the cycle has oxygen. When it breaks below, the mechanical pressure of underwater sellers takes over.
This guide covers the formula, UTXO age-band decomposition, interpretation zones, four cycle examples, and a practical trading playbook - with live data as of March 2026.
TL;DR
- What it measures: The weighted average acquisition price of all coins held for fewer than 155 days
- Key threshold: Price above STH Realized Price = bull structure; price below = bear structure
- Best use case: Dynamic support/resistance identification, DCA entry timing, macro regime classification
- Main limitation: 155-day cutoff is arbitrary; exchange coins and lost keys introduce noise
- Combine with: STH-MVRV, STH-SOPR, UTXO Age Band distribution
Table of Contents
- What Is STH Realized Price?
- Formula
- Data Sources
- How STH Realized Price Is Calculated
- How to Interpret STH Realized Price Values
- Historical Cycle Examples
- Practical Application
- STH Realized Price vs Related Metrics
- How STH Realized Price Relates to Other Indicators
- Limitations
- FAQ
- Conclusion
What Is STH Realized Price?
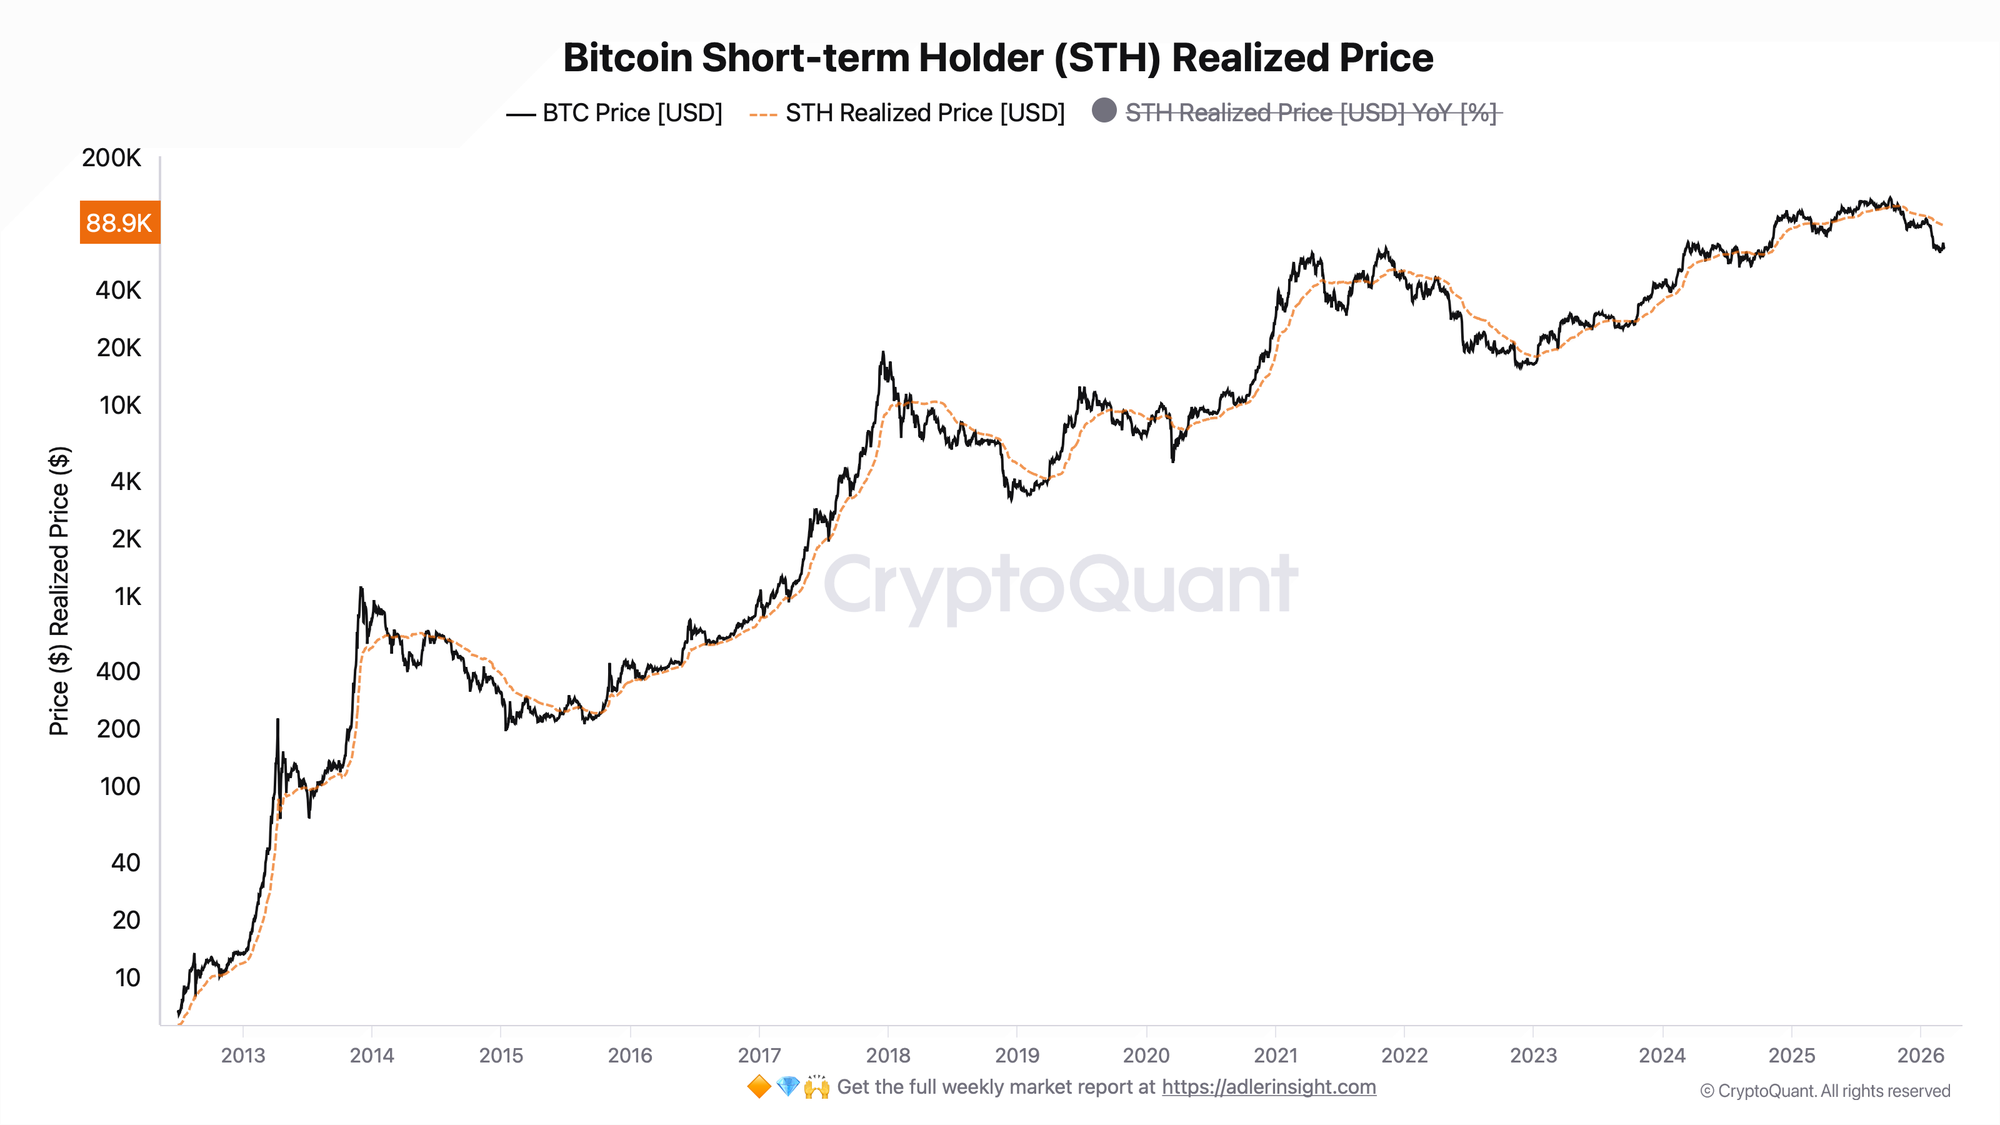
Realized Price is Bitcoin's "true" average cost basis - not the current market price, but the price at which each coin last moved on-chain. Aggregate all UTXOs (Unspent Transaction Outputs), value each at the price when it last transacted, and divide by circulating supply. That is the network-wide breakeven level.
STH Realized Price narrows this calculation to a specific cohort: coins that moved within the last 155 days. This captures retail traders, momentum buyers, and recent institutional accumulation - market participants who are statistically most likely to react to unrealized loss. Long-term holders (155+ days) tend to hold through volatility; short-term holders tend to capitulate.
The 155-day threshold is not arbitrary. Research by Glassnode and CryptoQuant across multiple cycles has shown that coins held longer than this rarely return to the market during normal corrections - they behave more like conviction holdings than speculative positions.
In one line: STH Realized Price is the weighted average price paid for every bitcoin that has moved in the last 155 days, making it the market's most sensitive cost-basis barometer.
Formula
Aggregate Realized Price (market-wide)
Realized Price = Realized Cap / Circulating Supply

Where:
  Realized Cap  = Σ (UTXO_i × Price_at_last_move_i)  for all UTXOs
  Circulating Supply = total BTC in circulation
STH Realized Price (cohort-specific)
STH Realized Price = STH Realized Cap / STH Supply

Where:
  STH Realized Cap = Σ (UTXO_i × Price_at_last_move_i)  for UTXOs aged 0–155 days
  STH Supply       = total BTC in those UTXOs
Weighted STH Cost Basis (UTXO Age Band approach)
The most granular version weights each age band by its share of Realized Cap:
Weighted STH CB = Σ (RP_band_k × RealizedCap_share_k)

Where:
  RP_band_k          = Realized Price of age band k
  RealizedCap_share_k = band k's share of total Realized Cap
Variable definitions:
UTXO_i- individual unspent output, valued at time of last on-chain movePrice_at_last_move_i- spot price when that UTXO was created/transferredSTH Supply- coins that last moved 0–155 days agoRealizedCap_share_k- the economic weight of that age cohort in the network
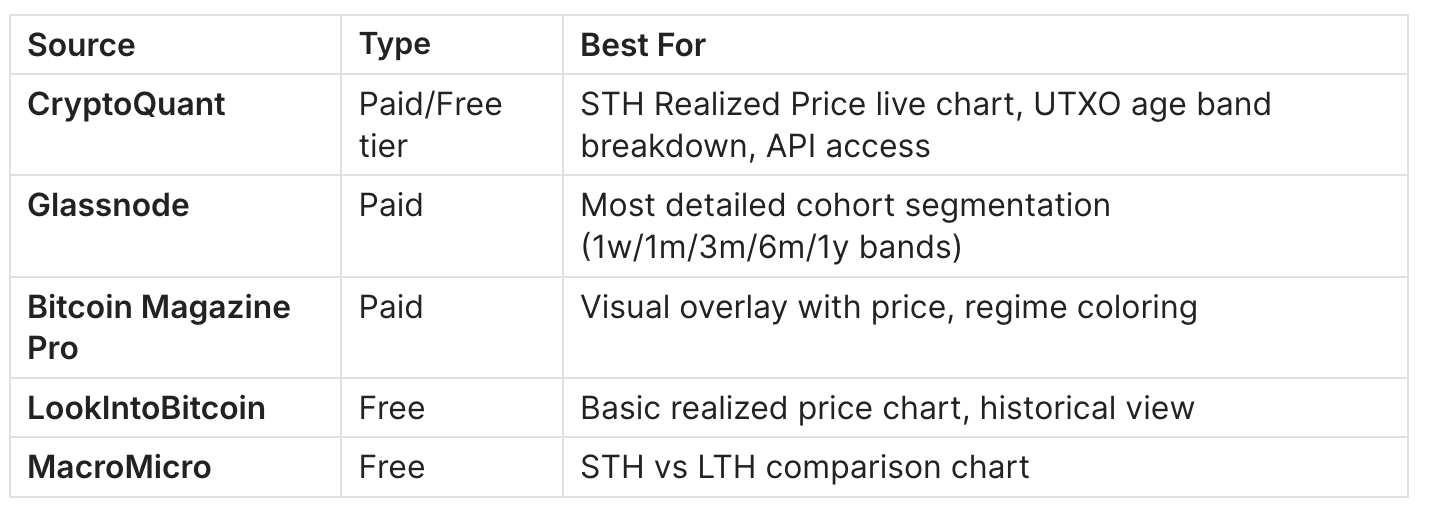
Data Sources
How STH Realized Price Is Calculated
Step 1: Index Every UTXO by Age
The Bitcoin blockchain is scanned to identify every unspent output. Each UTXO carries a timestamp - the block when it was last transacted. UTXOs with age ≤ 155 days are flagged as "short-term holder" supply.
Step 2: Value Each UTXO at Its Creation Price
Each STH UTXO is multiplied by the BTC/USD spot price at the time it was created. This produces the "realized value" of that output - what its owner actually paid (or received) for those coins.
Step 3: Aggregate to STH Realized Cap
All individual realized values are summed:
STH Realized Cap = Σ (UTXO_i_btc × price_when_created_i)
Step 4: Divide by STH Supply
STH Realized Price = STH Realized Cap / STH Supply
This gives the average cost basis across all recent buyers.
Step 5 (Advanced): Decompose by UTXO Age Bands
For a more precise view, break the 0–155 day window into sub-bands and weight by Realized Cap share:
Bands: 0d–1d | 1d–1w | 1w–1m | 1m–3m | 3m–6m
Worked Example (as of March 8, 2026 - live CryptoQuant data):
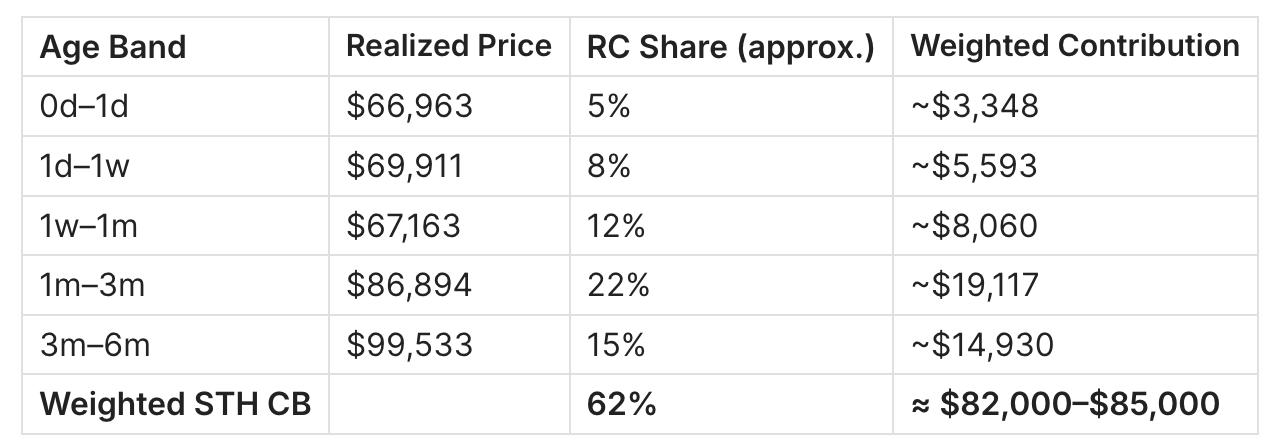
Note: The 1m–3m cohort's high realized price (~$86.9k) reflects the Q4 2025 accumulation wave. The aggregate CryptoQuant Realized Price (all holders) is currently $54,470 (March 8, 2026), reflecting the much lower cost basis of long-term and dormant coin holders.
Process visualization:

  Blockchain UTXOs
       │
       ▼
  [Age Filter: ≤ 155d]
       │
       ├─ 0d–1w:   RP ~ $68k
       ├─ 1w–1m:   RP ~ $67k
       ├─ 1m–3m:   RP ~ $87k   ◄── largest recent cohort
       ├─ 3m–6m:   RP ~ $100k
       └─ 6m–155d: (transitions to LTH threshold)
              │
              ▼
       STH Realized Cap / STH Supply
              │
              ▼
       STH Realized Price  ← dynamic support/resistance level
How to Interpret STH Realized Price Values
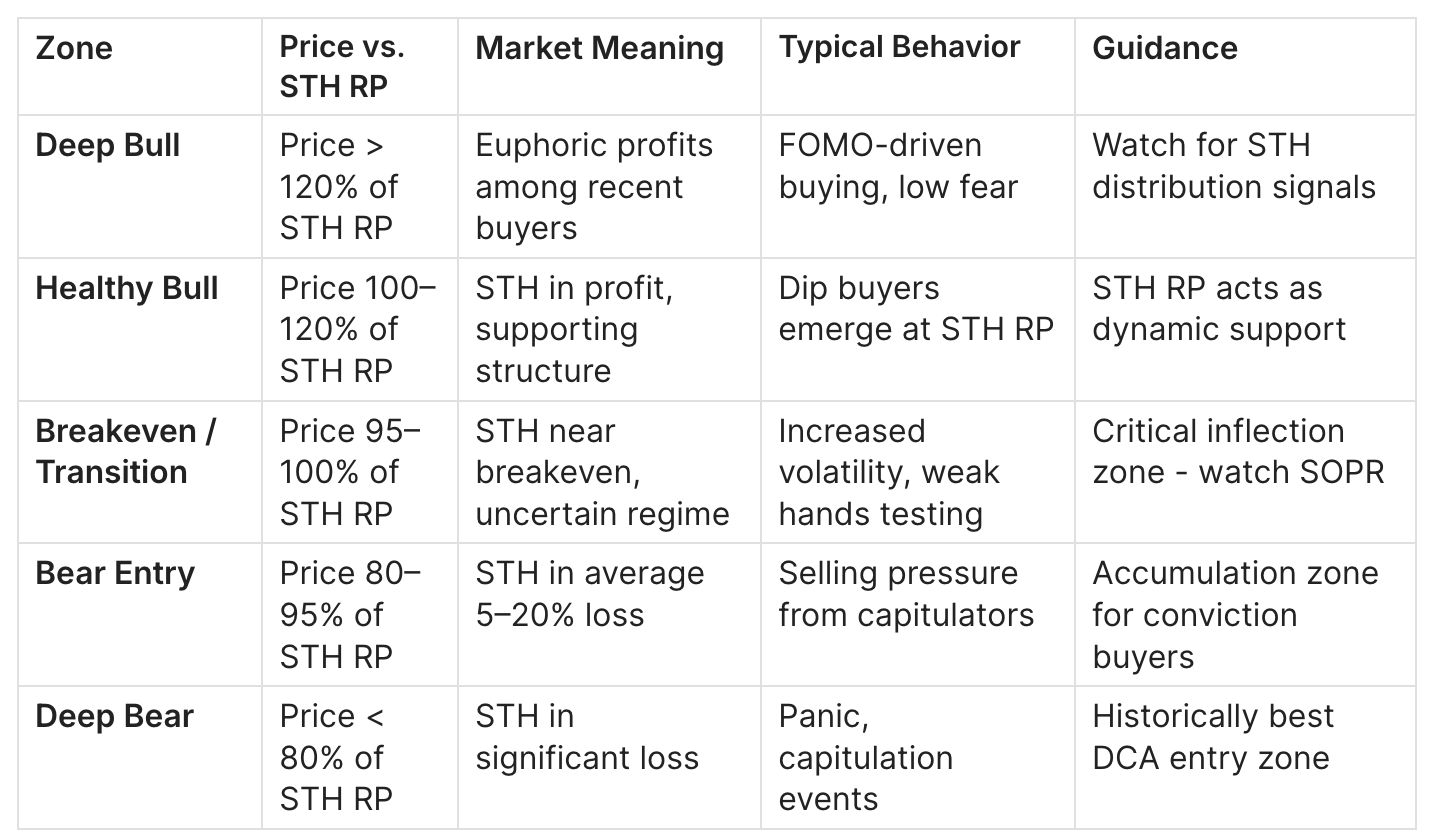
Zone Table
Price Above STH Realized Price
When BTC trades above STH Realized Price, the average recent buyer is in profit. This creates a self-reinforcing cycle: holders are less likely to sell, supply contracts, and upward pressure builds on price. Historically every sustained Bitcoin bull market has maintained price above STH RP for extended periods - weeks to months - without a decisive break below.
The main risk at this level is complacency: STH RP becomes widely watched, and large players may use it as a target for stop hunts. Brief wicks below STH RP that recover quickly are common and do not invalidate the bull structure.
Common mistake: Treating a single candle close below STH RP as a cycle-top signal. The key is sustained daily closes, not intraday moves.
Price Below STH Realized Price
When spot price falls below STH Realized Price, the average recent buyer is underwater. This mechanical pressure matters because short-term holders have empirically lower loss tolerance than long-term holders. The result: capitulation selling, rising STH-SOPR below 1.0, and increased exchange inflows from this cohort.
The critical question is whether the break is temporary (demand absorbs selling) or persistent (bear market begins). Historically, bear markets are characterized by STH RP acting as resistance rather than support - every bounce gets sold back into the cost basis level.
Current signal (March 8, 2026): BTC at ~$65,974. STH SOPR = 0.991 (selling at slight loss). The 1m–3m cohort has a cost basis near $86.9k and the 3m–6m cohort near $99.5k - both significantly above current price, confirming STH stress. This is consistent with the bear structure noted by CryptoQuant analysts: "STH losses suggest a depressed market structure… unrealized losses of around 26.3%."
The STH Realized Price Crossover (Key Signal)
The most powerful application is the price/STH-RP crossover:
- Bullish cross: Price reclaims STH RP from below → historically marks the end of bear markets and start of new bull legs
- Bearish cross: Price breaks below STH RP → historically marks entry into distribution/bear phase
Historical Cycle Examples
Example 1: 2017–2018 Top and Crash
Situation: BTC reached $19,800 in December 2017 - the cycle top.
Metric behavior: During the 2018 bear market, BTC broke decisively below STH Realized Price in early 2018 and STH RP acted as resistance for the remainder of the year. STH RP continued to decline as the cohort rolled over at lower and lower entry prices.
Price behavior: From $19,800, BTC fell to $3,200 by December 2018 (-84%). The sustained break below STH RP in February 2018 gave the structural bear signal months before most analysts capitulated.
Conclusion:
- Sustained close below STH RP in a topping market = bear market confirmation
- STH RP as resistance throughout 2018 - no failed reclaim until November 2020
Example 2: 2020 COVID Crash and Recovery
Situation: March 2020 saw BTC crash from $9,200 to $3,800 in 48 hours.
Metric behavior: STH RP briefly acted as overhead resistance post-crash but was reclaimed rapidly by May 2020. The speed of the reclaim was anomalous - institutional demand (MicroStrategy, Square) absorbed the selling immediately.
Price behavior: BTC went from $3,800 to $29,300 by December 2020. The May 2020 reclaim of STH RP above ~$7,000 was the on-chain confirmation of the new bull cycle.
Conclusion:
- Rapid reclaim of STH RP after capitulation = strong bull re-entry signal
- 2020 showed that reclaim speed matters as much as the reclaim itself
Example 3: 2021 Double-Top and 2022 Bear Market
Situation: BTC peaked at $69,000 in November 2021.
Metric behavior: STH RP in January 2022 was near $47,000. The break below this level coincided with the Luna/Terra collapse in May 2022, confirmed the bear trend. By November 2022 (FTX collapse), STH RP was near $25,000 with BTC trading at $16,000 - STH cohort was in ~35% average loss.
Price behavior: BTC fell from $69k to $15,500 (-78%). The June 2022 break below $20k put the majority of STH cohort into deep loss, triggering the cascading capitulation event.
Conclusion:
- June 2022 STH RP breach at $29k–$25k range = textbook bear market structural signal
- Extreme STH losses (>25%) have historically coincided with cycle bottom formations
Example 4: 2024–2025 Bull Cycle and 2026 Correction
Situation: BTC reached ATH ~$124k in late 2025 (CryptoQuant data confirms 12m–18m cohort cost basis at ~$88k, 6m–12m at ~$106k). In early 2026, BTC corrected sharply.
Metric behavior (live data): As of March 8, 2026:
- BTC price: ~$65,974
- Aggregate Realized Price: $54,470 (all holders still in profit)
- 1m–3m cohort cost basis: ~$86,894 (these holders are ~23% underwater)
- 3m–6m cohort cost basis: ~$99,533 (these holders are ~34% underwater)
- STH-SOPR: 0.991 (selling at slight loss)
Price behavior: The -47% correction from ATH brought spot below both the 1m–3m and 3m–6m cohort cost bases, creating the "depressed market structure" pattern - STH holding historically high unrealized losses.
Conclusion:
- STH cohort breakdown by age band reveals layered support/resistance levels
- When both 1m–3m AND 3m–6m cohorts are underwater, bear market behavior dominates
- Aggregate Realized Price ($54,470) remains the ultimate macro support - price is still 21% above it
Practical Application
Accumulation / DCA Conditions
Signal condition: Price within 0–15% of STH Realized Price, or below it
Confirmation conditions:
- STH-SOPR < 1.0 for 7+ consecutive days (realized losses = capitulation underway)
- STH-MVRV < 1.0 (cohort in aggregate loss)
- Exchange inflows declining after a spike (selling pressure exhausted)
Traps:
- Bear markets can persist well below STH RP for months - don't assume an instant bounce
- A single STH RP test is not confirmation; wait for STH-SOPR to recover above 1.0
Risk guidance: STH RP below spot = the most historically reliable DCA zone. Position sizing should reflect distance from STH RP: closer to it → smaller incremental buys; significantly below it (>15%) → larger allocations. This is the logic underlying the Smart DCA signal framework.
Risk-Off / Exit Conditions
Signal condition: Price 20–35%+ above STH Realized Price sustained for multiple weeks
Confirmation conditions:
- STH-MVRV > 1.3–1.4 (short-term holders sitting on significant unrealized gains)
- STH-SOPR persistently above 1.02 (realized profit-taking accelerating)
- UTXO age band: 1w–1m cohort growing rapidly (new speculative demand chasing price)
Traps:
- In a true bull cycle, STH RP can trail spot for months. Exiting too early is the most common mistake
- STH MVRV crossing 1.2 is not a sell - it is a "monitor closely" signal
Risk guidance: Trim position size, not wholesale exit. The productive use of this signal is reducing leverage and moving to spot-only, not full exits.
Neutral / Wait Conditions
Signal condition: Price within 5% of STH Realized Price, direction unclear
What to watch:
- Is STH-SOPR recovering above 1.0? → Bullish lean
- Are STH exchange inflows rising? → Bearish lean
- Is the dominant band (by RC share) above or below spot? → Identifies the pressure vector
STH Realized Price vs Related Metrics
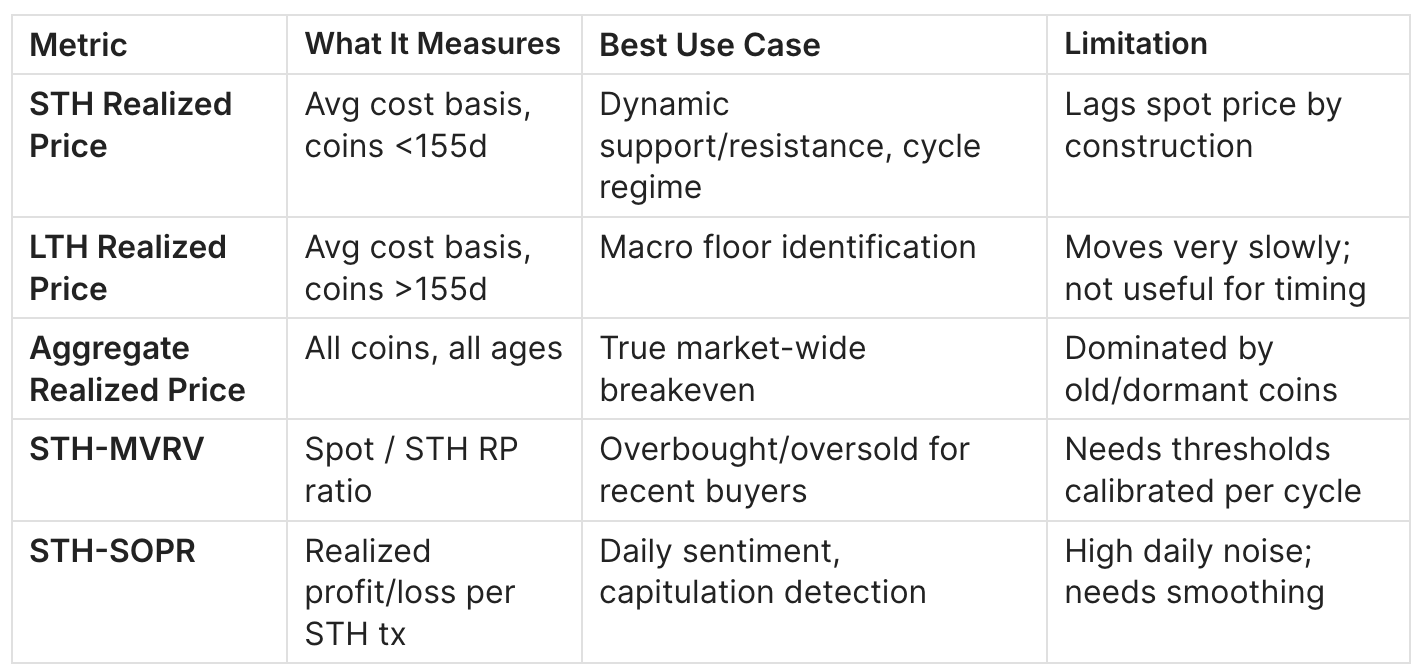
When to use STH RP vs STH-MVRV:
Use STH Realized Price when you need an absolute dollar level (support/resistance zone on a price chart). Use STH-MVRV when you want a normalized ratio signal (>1.2 = risk-off zone, <0.85 = accumulation zone). They are the same underlying data expressed differently - STH-MVRV = Spot Price / STH Realized Price.
Combined analysis recipe:
Entry filter: STH-MVRV < 1.0 AND STH-SOPR < 1.0 (both confirming loss)
Exit filter:  STH-MVRV > 1.3 AND STH-SOPR > 1.03 (both confirming profit-taking)
How STH Realized Price Relates to Other Indicators
Bridge formulas:
STH-MVRV = Spot Price / STH Realized Price
  → When STH-MVRV = 1.0, Spot = STH Realized Price (breakeven)

STH Unrealized P/L % = (Spot / STH RP - 1) × 100
  → Current (Mar 8, 2026): ($65,974 / ~$83,000 - 1) ≈ -20.5% for weighted STH

STH Realized Price ≈ Aggregate RP × (STH Supply / Total Supply) × adjustment factor
  → STH RP always > Aggregate RP in a post-peak market (recent buyers paid more)

NUPL (STH) ≈ (Market Cap - STH Realized Cap) / Market Cap
  → Negative NUPL for STH = bear signal
Indicator relationships:
- STH-SOPR is the flow signal; STH Realized Price is the stock signal. SOPR tells you what's happening today; RP tells you the aggregate state of the cohort. Use both together.
- MVRV Z-Score uses aggregate Realized Price (all holders). STH RP is more sensitive because it excludes dormant/lost coins.
- Realized Price by age band (the UTXO distribution endpoint) is the decomposed form of STH RP - it shows the internal structure, not just the aggregate.
See also:
Bitcoin MVRV: Definition, Formula & Cycle Signals | Bitcoin SOPR Guide |
STH vs LTH Cost Basis: Support/Resistance Framework
STH Realized Price Limitations
1. The 155-day threshold is a convention, not a law
No fundamental principle says a buyer who holds 154 days is behaviorally different from one holding 156 days. The threshold was empirically derived and is broadly accepted, but it means the STH/LTH split is a model, not ground truth.
Mitigation: Use UTXO age band breakdown (0d–1m, 1m–3m, 3m–6m) for more granular analysis. Don't rely solely on the 155-day aggregate.
2. Exchange wallet aggregation introduces noise
Coins on exchanges can be transferred internally without representing economic trades. These "internal moves" reset the age clock but don't represent a new market participant entering. This slightly inflates STH Supply and can distort the realized price during high exchange activity periods.
Mitigation: Cross-check with exchange-adjusted metrics where available (Glassnode provides entity-adjusted versions).
3. Lost coins and dormant wallets understate LTH cost basis
Very old coins (Satoshi-era, early miners) likely represent lost coins with a near-zero cost basis. Their inclusion in the aggregate realized price creates a permanently lower floor for the all-holder metric. STH RP is less affected by this since it only uses recent activity.
Mitigation: No clean fix. Treat aggregate Realized Price as a lower-bound estimate for the true market-wide cost basis.
4. STH RP lags in fast markets
In rapid price movements (±20% in a week), the STH cohort's composition changes faster than the metric updates. The realized price is always backward-looking by construction.
Mitigation: Combine with SOPR (which updates daily/block-by-block) for real-time sentiment. Use STH RP as the medium-term anchor, SOPR as the high-frequency signal.
FAQ
What is Bitcoin STH Realized Price?
Bitcoin STH (Short-Term Holder) Realized Price is the average acquisition cost of all Bitcoin that has moved on-chain within the last 155 days. It represents the collective breakeven level of recent market participants - traders, new retail buyers, and recent institutional accumulators. When BTC spot price is above this level, the recent-buyer cohort is in aggregate profit. When below, they are in aggregate loss.
Where can I find STH Realized Price data?
The most reliable sources are CryptoQuant, Glassnode (with their proprietary entity-adjusted version), Bitcoin Magazine Pro (visual overlay), and MacroMicro (free chart with STH/LTH comparison). For raw UTXO age band data,
Why is STH Realized Price different from the aggregate Realized Price?
Aggregate Realized Price values all circulating coins, including coins that haven't moved in 10+ years (early miners, lost wallets). As of March 8, 2026, it is ~$54,470. STH Realized Price only values coins that moved in the last 155 days - a much smaller, more active subset. Because recent activity occurred at higher prices, STH RP is always higher than the aggregate in a post-cycle-top environment. The spread between them is itself informative: a wide spread signals that long-term holders have a massive unrealized gain cushion.
What does it mean when price breaks below STH Realized Price?
It means the average recent buyer is now at a paper loss. Historically this has triggered two types of market behavior: (1) capitulation selling from those who cannot tolerate losses, amplifying downward pressure; and (2) eventual absorption by patient capital (LTHs, value buyers, institutions) who treat the level as attractive. In bear markets, STH RP acts as resistance after the break. In bull market corrections, the level is reclaimed quickly.
How reliable is STH Realized Price as a cycle indicator?
Across four major Bitcoin cycles (2013–2014, 2017–2018, 2020–2021, 2021–2022), the STH RP crossover has provided reliable macro-regime signals. Bull markets are defined by sustained price above STH RP; bear markets by sustained price below. The signal is less reliable for short-term timing - price can oscillate around STH RP for weeks during transition phases.
Can STH Realized Price be used for Bitcoin DCA timing?
Yes, and it is one of the most principled bases for DCA signal design. The core logic: buy more aggressively when spot is near or below STH RP (mean reversion expectation) and reduce contribution rate when spot is significantly above STH RP (elevated risk). This is the conceptual foundation of the Smart DCA signal framework, which uses MA-based proxies for STH RP in real-time execution.
What is the difference between STH SOPR and STH Realized Price?
STH-SOPR (Spent Output Profit Ratio) measures the realized profit or loss on coins actually being sold on a given day. STH Realized Price measures the unrealized aggregate cost basis of the entire cohort. SOPR is a flow metric (what's happening now); RP is a stock metric (cumulative state). Current STH-SOPR of 0.991 (March 8, 2026) tells you that coins being moved today are being sold at a slight loss. STH RP tells you the average level at which those coins were purchased.
Why does the 1m–3m cohort have such a high cost basis right now?
The 1m–3m age band's realized price of ~$86,894 (March 8, 2026) reflects the fact that a significant volume of Bitcoin changed hands during the Q4 2025–early 2026 period when prices were elevated (near cycle highs). Those buyers are now sitting on unrealized losses of roughly 24% as BTC trades around $65,974. This cohort typically represents the "last wave" of buyers before a top - their stress level is a useful leading indicator for near-term selling pressure.
Conclusion
- STH Realized Price is the most actionable cost-basis metric for cycle timing - it measures the aggregate breakeven of active market participants, not dormant whales or lost coins
- As of March 8, 2026: Aggregate Realized Price = $54,470; BTC spot = $65,974; MVRV = 1.21 - the market remains above its network-wide cost basis, but the STH cohort (especially 1m–3m at ~$87k and 3m–6m at ~$100k) is under significant pressure
- The bull/bear regime signal is binary: sustained price above STH RP = accumulate; sustained price below = defensive posture
- UTXO age band decomposition reveals the internal structure - which cohorts have conviction vs. which are underwater and likely to sell
- Combine STH RP with STH-SOPR for daily flow confirmation and STH-MVRV for normalized cycle positioning
Track the Weekly Engine signal (7-layer confirmation): Adler Premium on Substack →
Combine With
STH-MVRV
Normalized version of STH RP - same data, ratio form. Use for overbought/oversold zones.
Guide: https://axeladlerjr.com/bitcoin-mvrv-ratio-definition-formula-cycle-signals/
STH-SOPR
Flow confirmation - tells you if current sellers are realizing profit or loss right now.
Guide: https://axeladlerjr.com/bitcoin-sth-sopr-what-it-is-and-how-to-use-it
UTXO Realized Price Age Distribution
Decompose STH RP by cohort to identify which buyer groups are under pressure.
Guide: https://axeladlerjr.com/bitcoin-lth-vs-sth-supply-dynamics-cost-basis-market-structure