
🎧 Morning Brief #156 - audio debate on today’s market setup
Since October, BTC has traveled from a strong premium to the short-term holder cost basis, into a deep discount, and is now returning to that zone again. At the same time, the 30D exchange inflow spread has risen from extremely weak levels, showing that the exchange imbalance toward selling has softened.
TL;DR
A brief on how BTC is approaching the short-term holder cost basis zone again, where the market often faces sellers exiting at breakeven. Meanwhile, exchange flows show not a return of strong demand, but an easing of sell-side pressure from BTC/ETH inflows.
Bitcoin Cost Basis (Realized Price) STH vs LTH
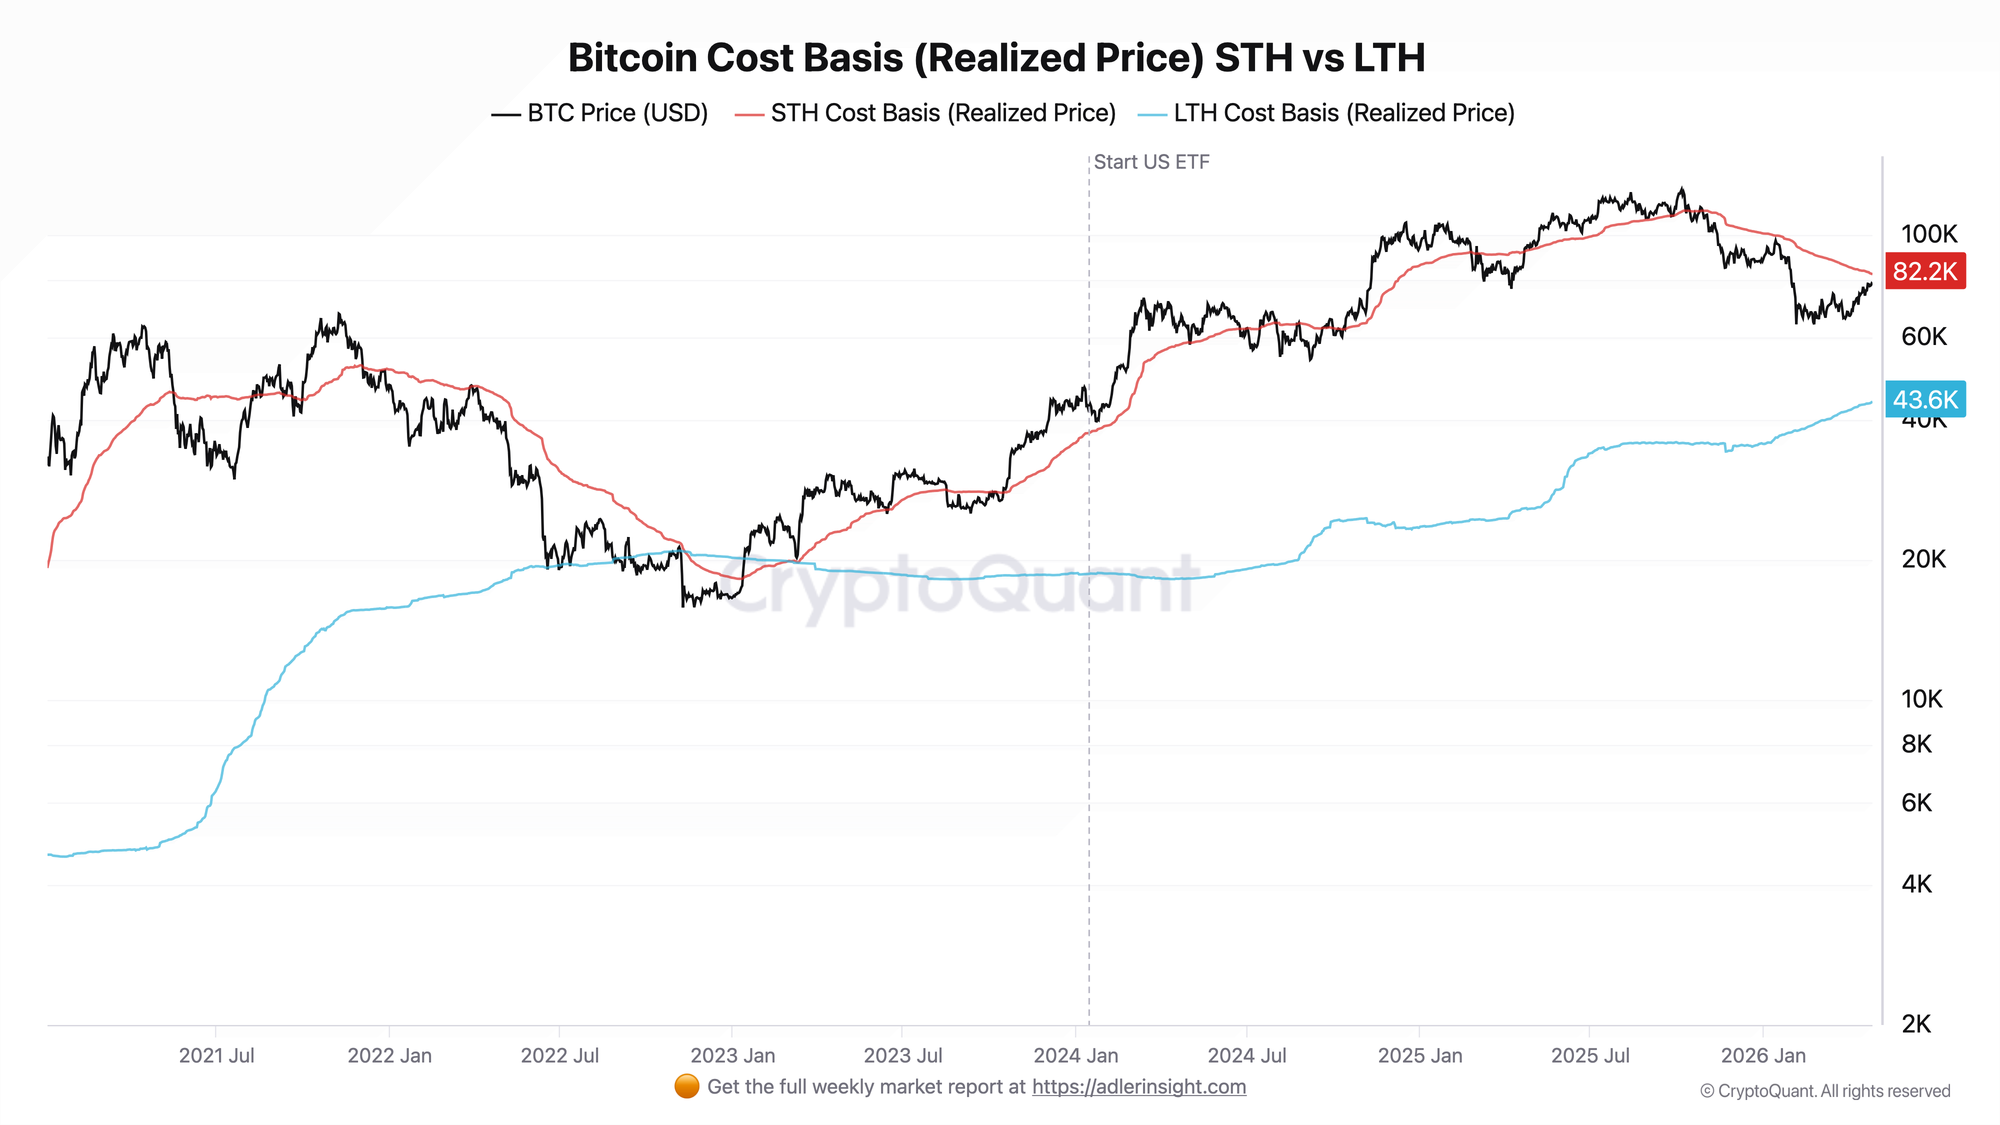
The metric compares the BTC market price with the realized price of short-term holders and long-term holders.
In October, BTC was trading above the STH Cost Basis and reached $124.9K, while the short-term holder cost basis was around $112K. After that, the market broke below this line, and the maximum discount to the STH Cost Basis reached approximately 32%. BTC is now at around $77.8K, while the STH Cost Basis sits at around $82.2K - meaning the market has again approached the zone where short-term holders are close to breaking even.
In simple terms: $82.2K is the breakeven zone for recent buyers. While BTC is below this level, some short-term holders remain underwater. When price approaches this zone, the market may face additional sell pressure from those who were waiting to exit at breakeven.
Exchange Inflow Spread All Stablecoins (ERC-20) - BTC,ETH
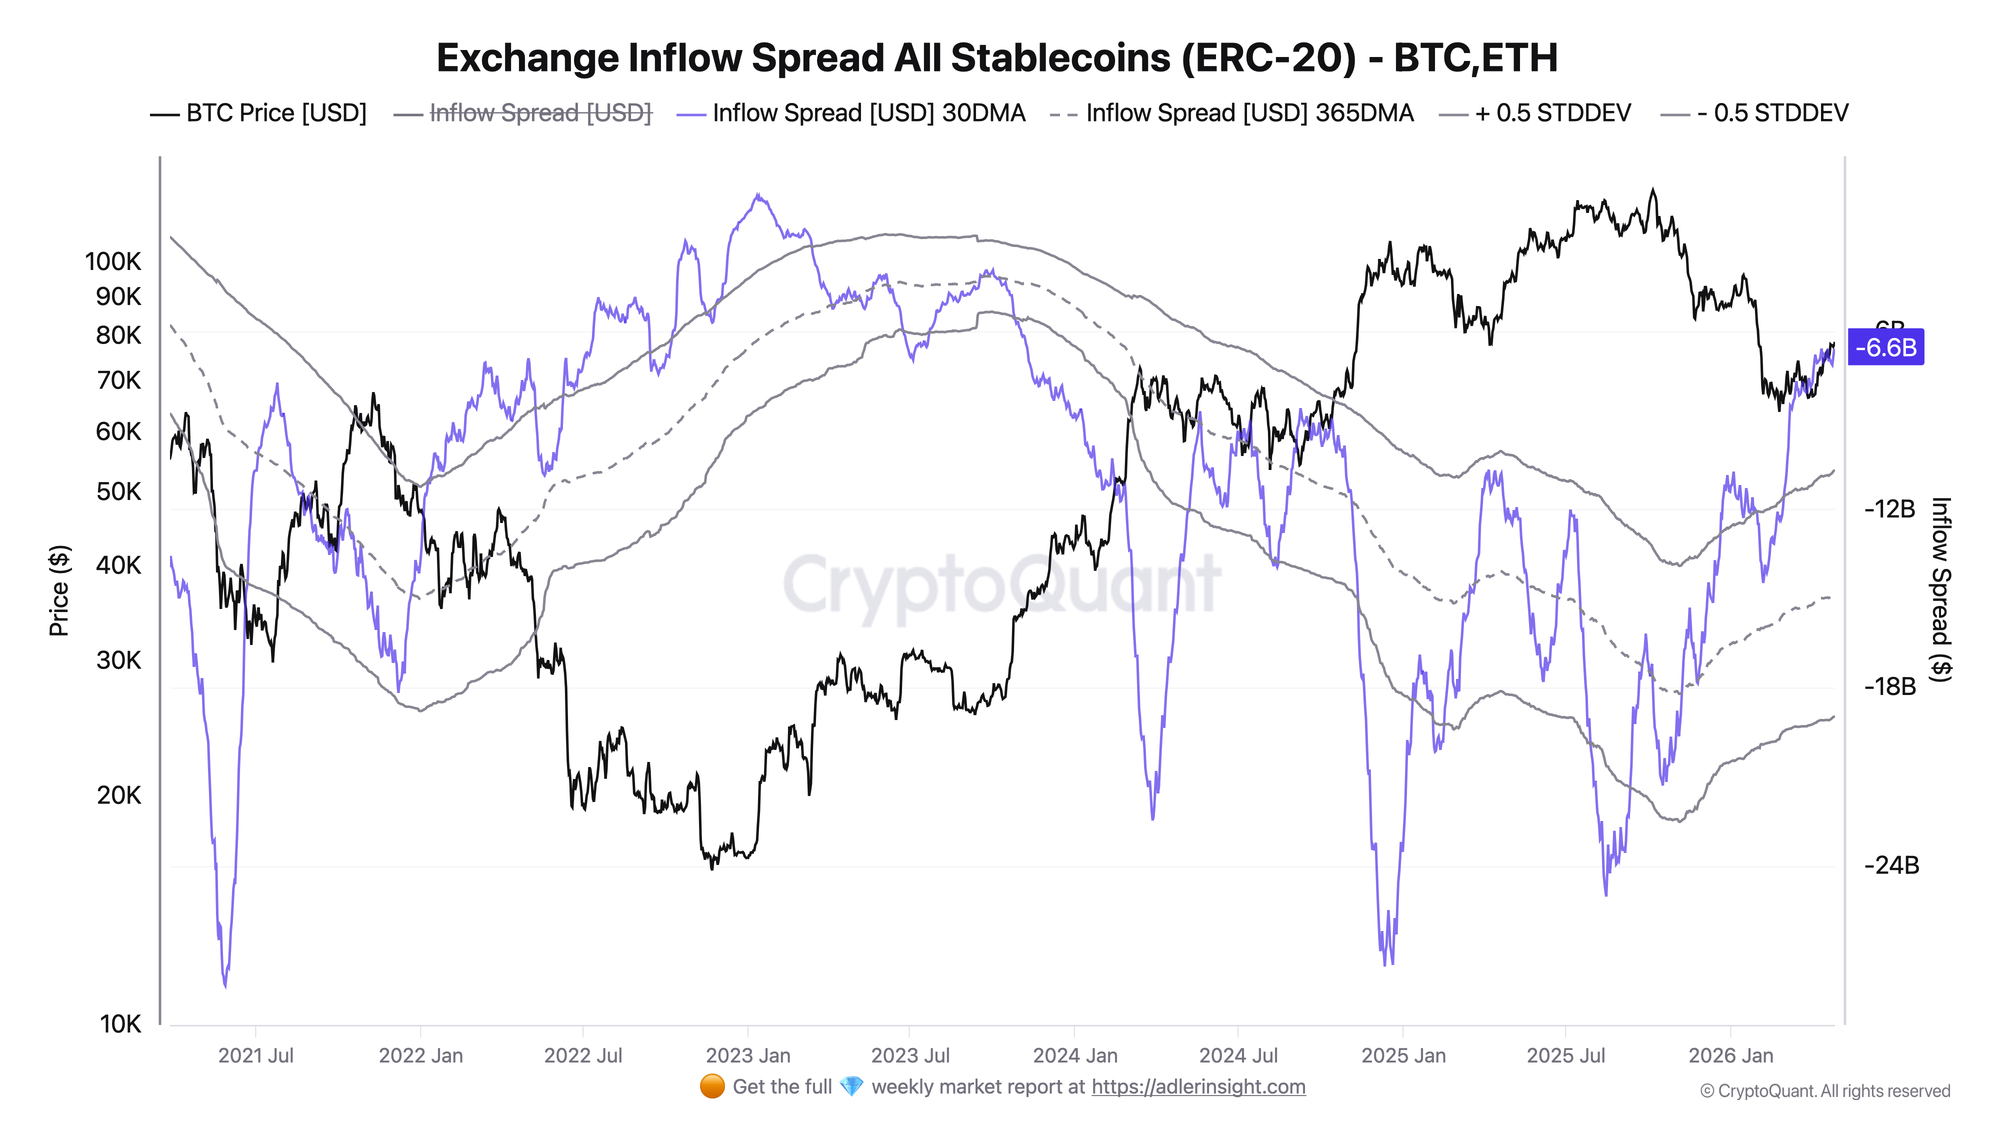
The metric shows the difference between stablecoin inflows to exchanges and BTC/ETH inflows to exchanges.
This spread is almost always negative, so it cannot be read as a conventional above-or-below-zero signal. What matters is not the negative zone itself, but the direction. In mid-October, the 30D spread fell to approximately -$21.3B; it has now risen to -$6.6B. From the local low, that is an improvement of approximately $14.7B.
This means BTC/ETH inflows are still dominating over stablecoin inflows, but no longer as aggressively as in October. In simple terms, the pressure from coins entering exchanges for potential sale has eased noticeably.
Connecting both charts: the first shows that BTC is approaching the zone where short-term holders may sell at breakeven, while the second shows that the overall exchange imbalance has become less severe. This is not a bullish confirmation, but it is no longer the same pressure structure that existed after the October breakdown.
Reading the signal is not enough - you need to act on it. Weekly Engine turns on-chain data into one clear decision per week, with risk caps and invalidation built in. Start free.
FAQ
Why is the STH Cost Basis zone so important? Because it is the average cost basis of short-term holders. When BTC returns to this line from below, some participants get the chance to close their position without a loss - which is why the zone often acts as resistance.
What would confirm market improvement? The key confirmation is BTC closing above the STH Cost Basis, with the 30D inflow spread continuing to rise or at least not returning to extremely negative values. If price rejects this zone again to the downside, breakeven selling becomes the primary risk.
CONCLUSIONS
Since October, BTC has lost its premium to the short-term holder cost basis and has traded below their breakeven zone for an extended period. Now price is approaching the STH Cost Basis again at around $82.2K, while the exchange inflow spread has risen noticeably from its October lows - indicating an easing of the exchange sell-pressure imbalance. The regime is becoming cautiously neutral, but not bullish: the key trigger is a close above the STH Cost Basis, and the key risk is a rejection from this zone and a new wave of selling from short-term holders exiting at breakeven.
Further Reading
- Bitcoin STH Realized Price: Definition, Formula & Cost Basis Framework
- Bitcoin LTH vs STH: Supply Dynamics, Cost Basis & Market Structure
- Bitcoin Realized Price Bands Explained: Cycle Analysis, Signals, and Historical Examples
- Bitcoin Exchange Netflow: What It Is and How to Use It
- Bitcoin Stablecoin Supply Ratio (SSR): Definition, Formula & Cycle Signals
- Bitcoin Exchange Reserve: Definition, Formula & Cycle Signals
- STH vs LTH Realized Price: Support & Resistance Guide
- Bitcoin Short-Term Holder Profitability: Break-Even as Bull/Bear Signal
- Bitcoin Supply in Profit: Definition, Thresholds & Market Signals
- Stablecoins Exchange Inflow: Definition, Formula & Signals
- Stablecoin Market Cap (USDT & USDC): Definition, Formula & Bitcoin Cycle Signals