
🎧 Morning Brief #137- audio debate on today’s market setup
Against the backdrop of the continuing S&P 500 decline, Bitcoin is no longer moving in sync with the index over a short window - but that does not signal a decoupling from risk assets. Two charts tell a more uncomfortable story: short-term correlation has weakened, yet BTC's relative strength against the S&P keeps deteriorating, meaning the market still prices Bitcoin as a higher-risk asset.
TL;DR
Short-term correlation between BTC and the S&P has weakened, but that has not given Bitcoin any edge. BTC's relative strength against the index remains poor, which means risk-off mode is still intact.
BTC-S&P Correlation (13-week)
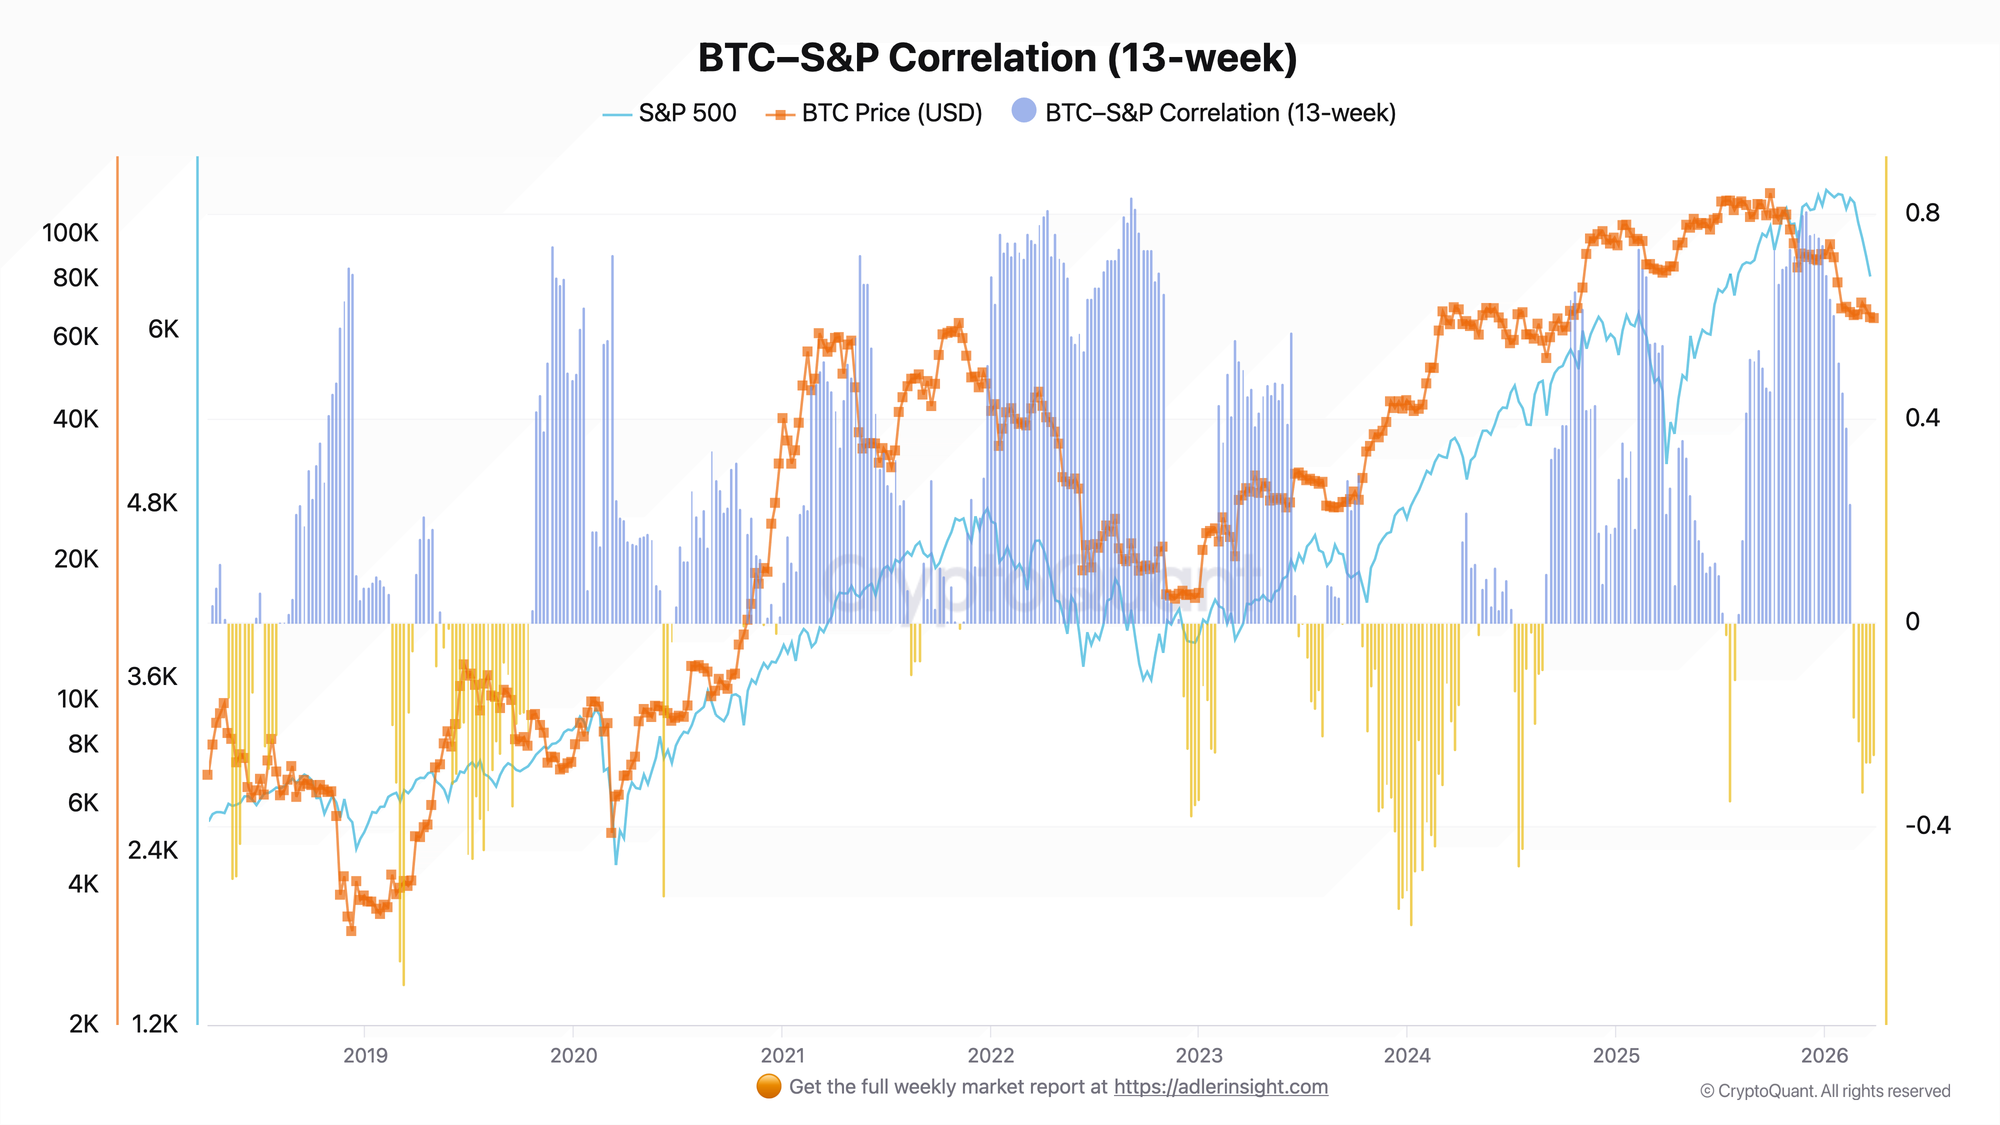
The 13-week correlation measures how closely the weekly returns of BTC and the S&P 500 have moved together over a short window.
Over recent weeks, the short-term correlation has turned negative and has been holding below zero. At first glance this might look like a loosening of the link between BTC and equities - but in practice it more likely reflects the choppy nature of recent weeks, where isolated Bitcoin bounces have alternated with continued weakness in the index. A falling correlation reading on its own is not a bullish signal, because it says nothing about the strength of BTC - only that the synchronicity of their moves has become less clean.
What matters to the market here is not the fact of negative correlation per se, but whether it is accompanied by sustained BTC outperformance over the S&P. That confirmation is not there yet, so it is too early to talk about Bitcoin achieving genuine independence from the risk-off regime.
BTC / S&P Price Ratio
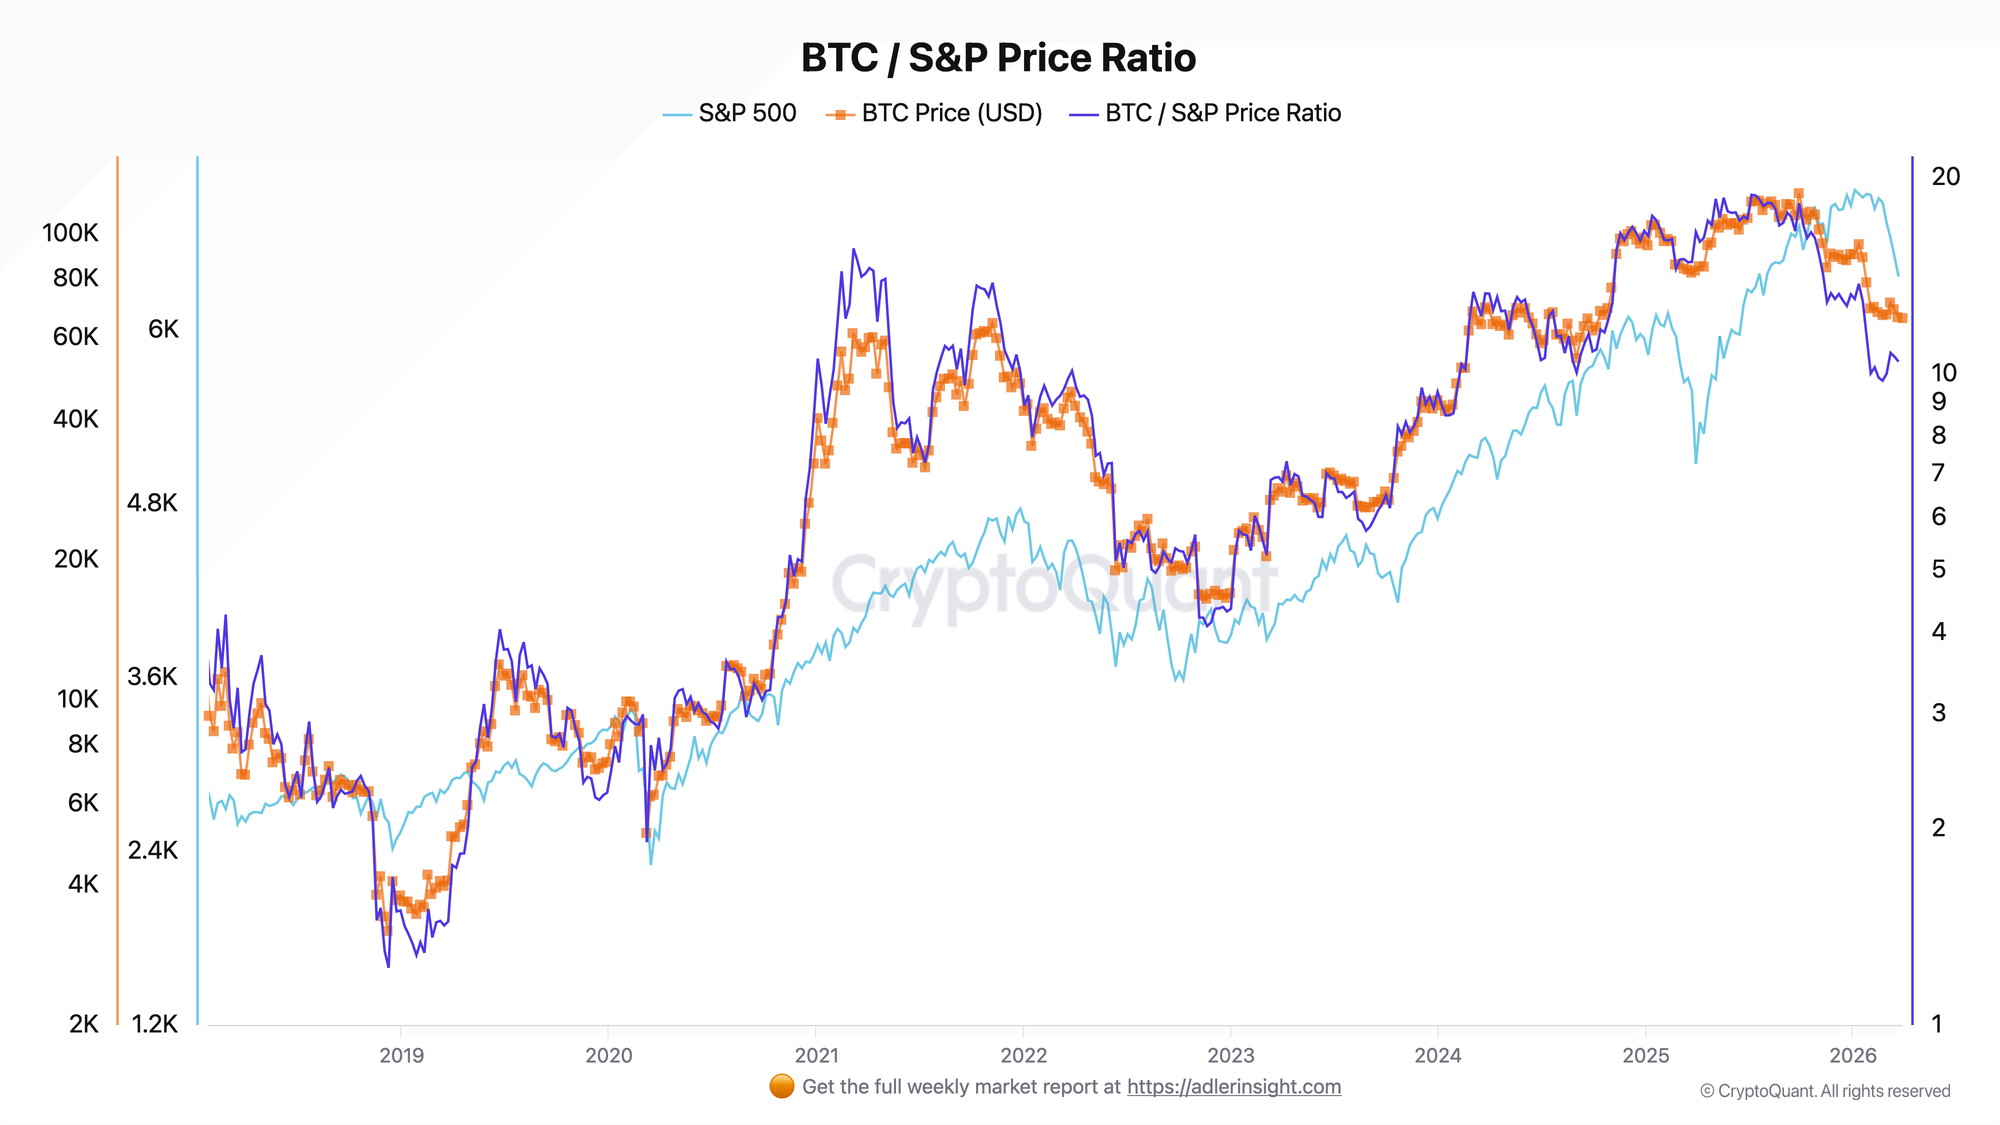
The metric reflects how BTC behaves relative to the S&P 500: a rising ratio means Bitcoin outperformance, a falling ratio means relative weakness.
Since the start of the year the ratio has declined noticeably, and over recent weeks it has remained under pressure. This means that even during periods when short-term correlation breaks down, BTC does not turn into a safe-haven asset and does not demonstrate sustained outperformance over the index. On the contrary, the market continues to price in higher risk and a larger drawdown amplitude for Bitcoin than for the S&P 500.
This is precisely what makes the current decline more meaningful than the correlation reading itself: the link with the equity market may be temporarily noisy, but BTC's relative weakness remains quite legible. Until the ratio stabilizes and starts to recover, it is premature to talk about a regime change.
Taken together, these two charts deliver a clean conclusion: formal correlation between BTC and the S&P is now a less reliable guide, but the relative dynamics still support a risk-off interpretation. In other words, the relationship has become less linear - but the market continues to price Bitcoin as a higher-risk asset than equities.
🔸 Invest in Bitcoin without emotional decisions - Start free. Deterministic signals built to remove fear, FOMO, and panic selling.
FAQ
Is negative correlation between BTC and the S&P a bullish signal? No. Negative short-term correlation means nothing on its own if BTC is not simultaneously showing sustained relative strength. That confirmation is absent right now.
What would signal a genuine decoupling of BTC from S&P weakness? The key trigger is a reversal of the BTC / S&P Price Ratio to the upside and its ability to sustain that move not just for one week, but as a new stable regime. Only then can one say that Bitcoin has stopped trading as a high-beta risk asset.
CONCLUSIONS
The market is currently sending an uncomfortable but fairly honest signal: the S&P 500 continues to decline, and BTC is not merely staying vulnerable to external risk-off pressure - it continues to underperform the index in relative terms. The prevailing regime remains risk-off: the primary trigger for improvement is an upside reversal in the BTC / S&P Price Ratio, and the primary risk is further S&P weakness, under which Bitcoin retains the risk of a deeper drawdown as the more volatile asset.
Further Reading
- Bitcoin MVRV Ratio: Definition, Formula & Cycle Signals
- Bitcoin NUPL (Net Unrealized Profit/Loss): What It Is and How to Use It
- Bitcoin LTH vs STH: Supply Dynamics, Cost Basis & Market Structure
- Institutional Bitcoin Flows: ETF, Coinbase Premium & OTC
- Spot ETFs and Global M2: Thresholds for Overriding the Bitcoin Halving Cycle
- Death of the 4-Year Cycle? Macro Liquidity vs. Halving
- Bitcoin Supply in Profit: Definition, Thresholds & Market Signals
- Bitcoin Short-Term Holder Profitability: Break-Even as Bull/Bear Signal