
TL;DR
Unrealized profit is "paper profit" - coins are worth more than their cost basis, but haven't been spent.
Realized profit is locked in when coins move on-chain (UTXO spent), confirming gains.
This distinction powers key metrics: NUPL, SOPR, Realized P/L, and Supply in Profit.
The Core Concept
Understanding the difference between realized and unrealized profit is fundamental to on-chain analysis. These concepts explain when profit exists versus when it impacts the market.
What is Unrealized Profit?
Unrealized profit exists when:
- A coin's cost basis (price when last moved) is below the current market price
- The coin has not been spent yet
Example:
- You received 1 BTC at $30,000 (your cost basis)
- Current price is $100,000
- Unrealized profit = $70,000
This profit is "on paper" - it exists in potential but hasn't been converted to actual gains. The market doesn't feel this profit until you act.
What is Realized Profit?

Realized profit occurs when a coin is spent on-chain:
- The UTXO (Unspent Transaction Output) is consumed
- A new UTXO is created at the current price (new cost basis)
- The difference between old and new cost basis = realized profit
Example:
- You spend 1 BTC that was acquired at $30,000
- Current price when spent: $100,000
- Realized profit = $70,000 (now locked in)
Key insight: Realized profit represents actual economic activity that can influence price through selling pressure.
The UTXO Model: Why On-Chain Can Measure This
Bitcoin's UTXO model makes profit tracking possible:
How It Works
- Receive coins → UTXO created with timestamp and value
- Hold coins → UTXO remains unchanged, accumulating unrealized P/L
- Spend coins → UTXO consumed, new UTXO created at current price
- Profit/Loss realized → Difference between creation and spend price
UTXO Created ($30,000) → Held → Spent ($100,000) → New UTXO ($100,000)
                                    ↓
                        Realized Profit: $70,000
This creates an immutable record of every Bitcoin's cost basis history.
When Unrealized Becomes Realized
On-chain data sees "spending" - not intent. Several actions trigger realization:
1. Selling on Exchange
Most common form of economic realization. Coins move to exchange → get sold → buyer receives new UTXO.
2. Wallet-to-Wallet Transfer
Even non-sale transfers count as "spending" on-chain:
- Self-transfers between your own wallets
- Moving to cold storage
- Consolidating UTXOs
The cost basis resets even if no sale occurred.
3. OTC and Settlement Flows
Large block trades and institutional settlements appear as normal transfers but represent economic realization.
Important: On-chain analysis cannot distinguish motivation - only movement. This is why combining with exchange flow data adds context.
Why This Matters for Market Analysis
The realized/unrealized distinction explains market structure at key turning points.
Market Tops: The Distribution Problem
Tops form through this sequence:
- High unrealized profit - most holders sitting on gains
- Incentive to sell rises - why risk paper gains?
- Realized profit spikes - holders begin locking in gains
- Price weakens - selling pressure exceeds new demand
- Cascade effect - unrealized profit shrinks, more rush to realize
Historical Example:
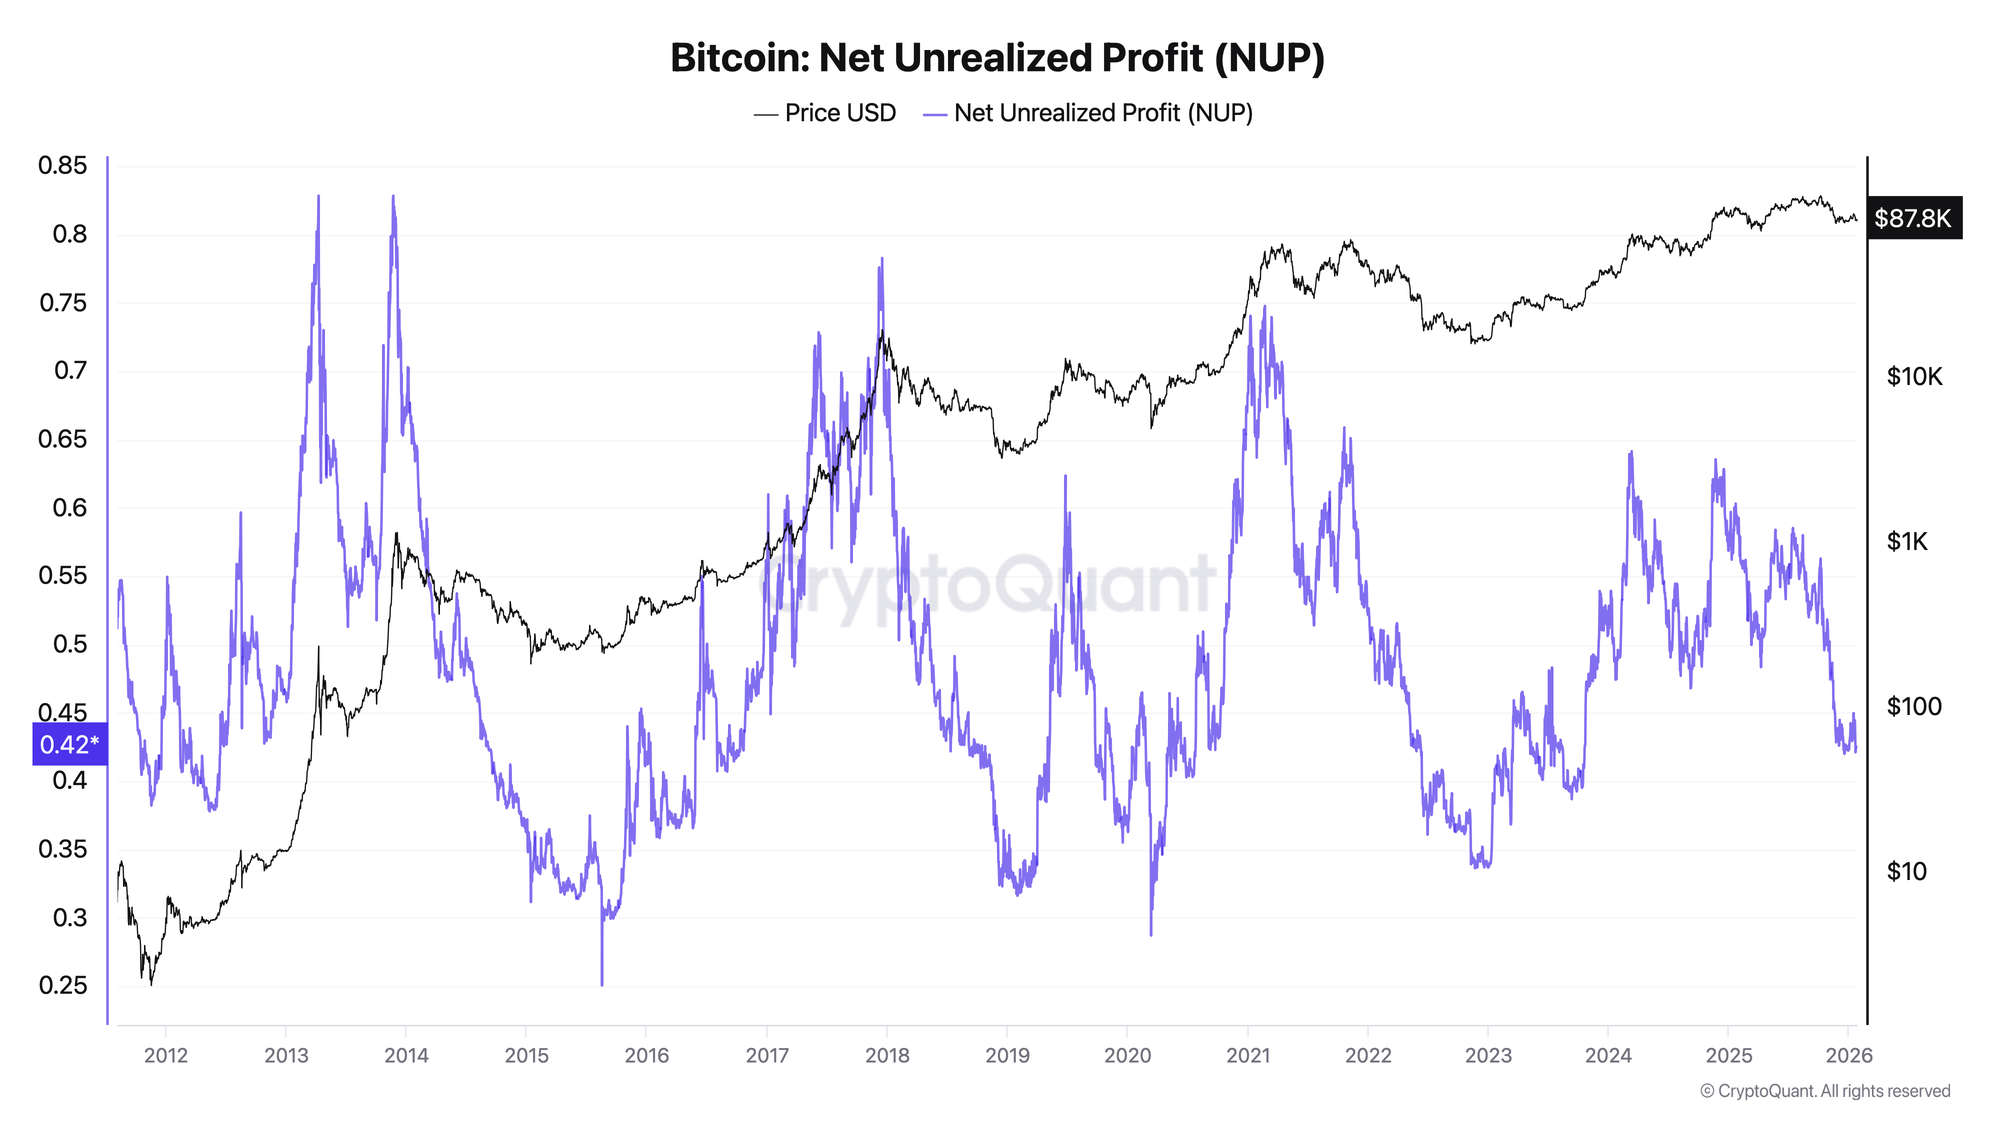
- December 16, 2017: Net Unrealized Profit (NUP) reached 0.783 - nearly 80% of market cap was unrealized gains
- This extreme preceded the 84% drawdown to $3,200
Market Bottoms: Selling Exhaustion
Bottoms form when:
- Unrealized losses dominate - most holders underwater
- Realized losses spike - capitulation selling
- Selling exhausts - no one left to sell
- Price stabilizes - new demand exceeds weakened supply
- Recovery begins - unrealized losses convert to unrealized profit
Historical Examples:

Pattern recognition: Notice how each major bottom showed NUPL going negative. This represents the point where aggregate market participants are underwater - a statistically rare condition that has preceded every major bull run.
Historical Cycle Analysis: Unrealized to Realized Flow
Understanding how profit flows from unrealized to realized state helps identify where we are in a cycle.
2017 Cycle: Classic Blow-Off Top
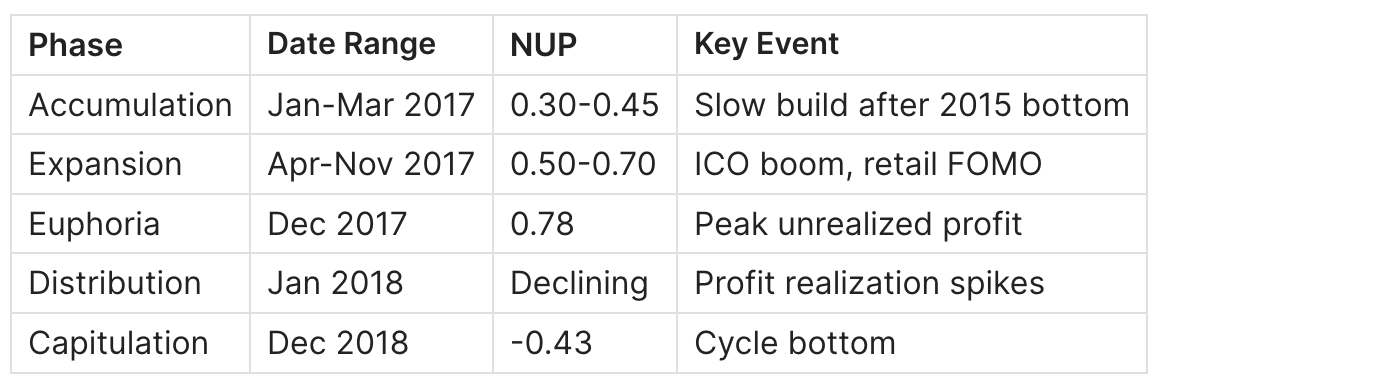
Key insight: NUP peaked at 0.783 on December 16, 2017 - meaning nearly 80% of market cap was unrealized gains. This extreme preceded the 84% drawdown.
2021 Cycle: Double-Top Structure
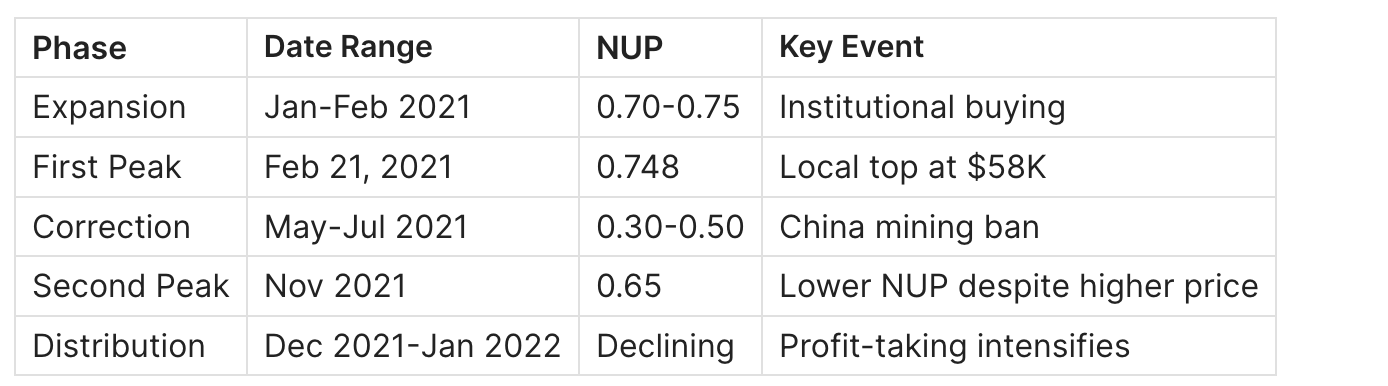
Key insight: The second ATH in November 2021 ($69K) showed lower NUP than the first peak ($58K in February). This bearish divergence - higher price, lower unrealized profit - signaled structural weakness.
Metrics Built on This Concept
Several key on-chain indicators derive from the realized/unrealized framework:
NUPL (Net Unrealized Profit/Loss)
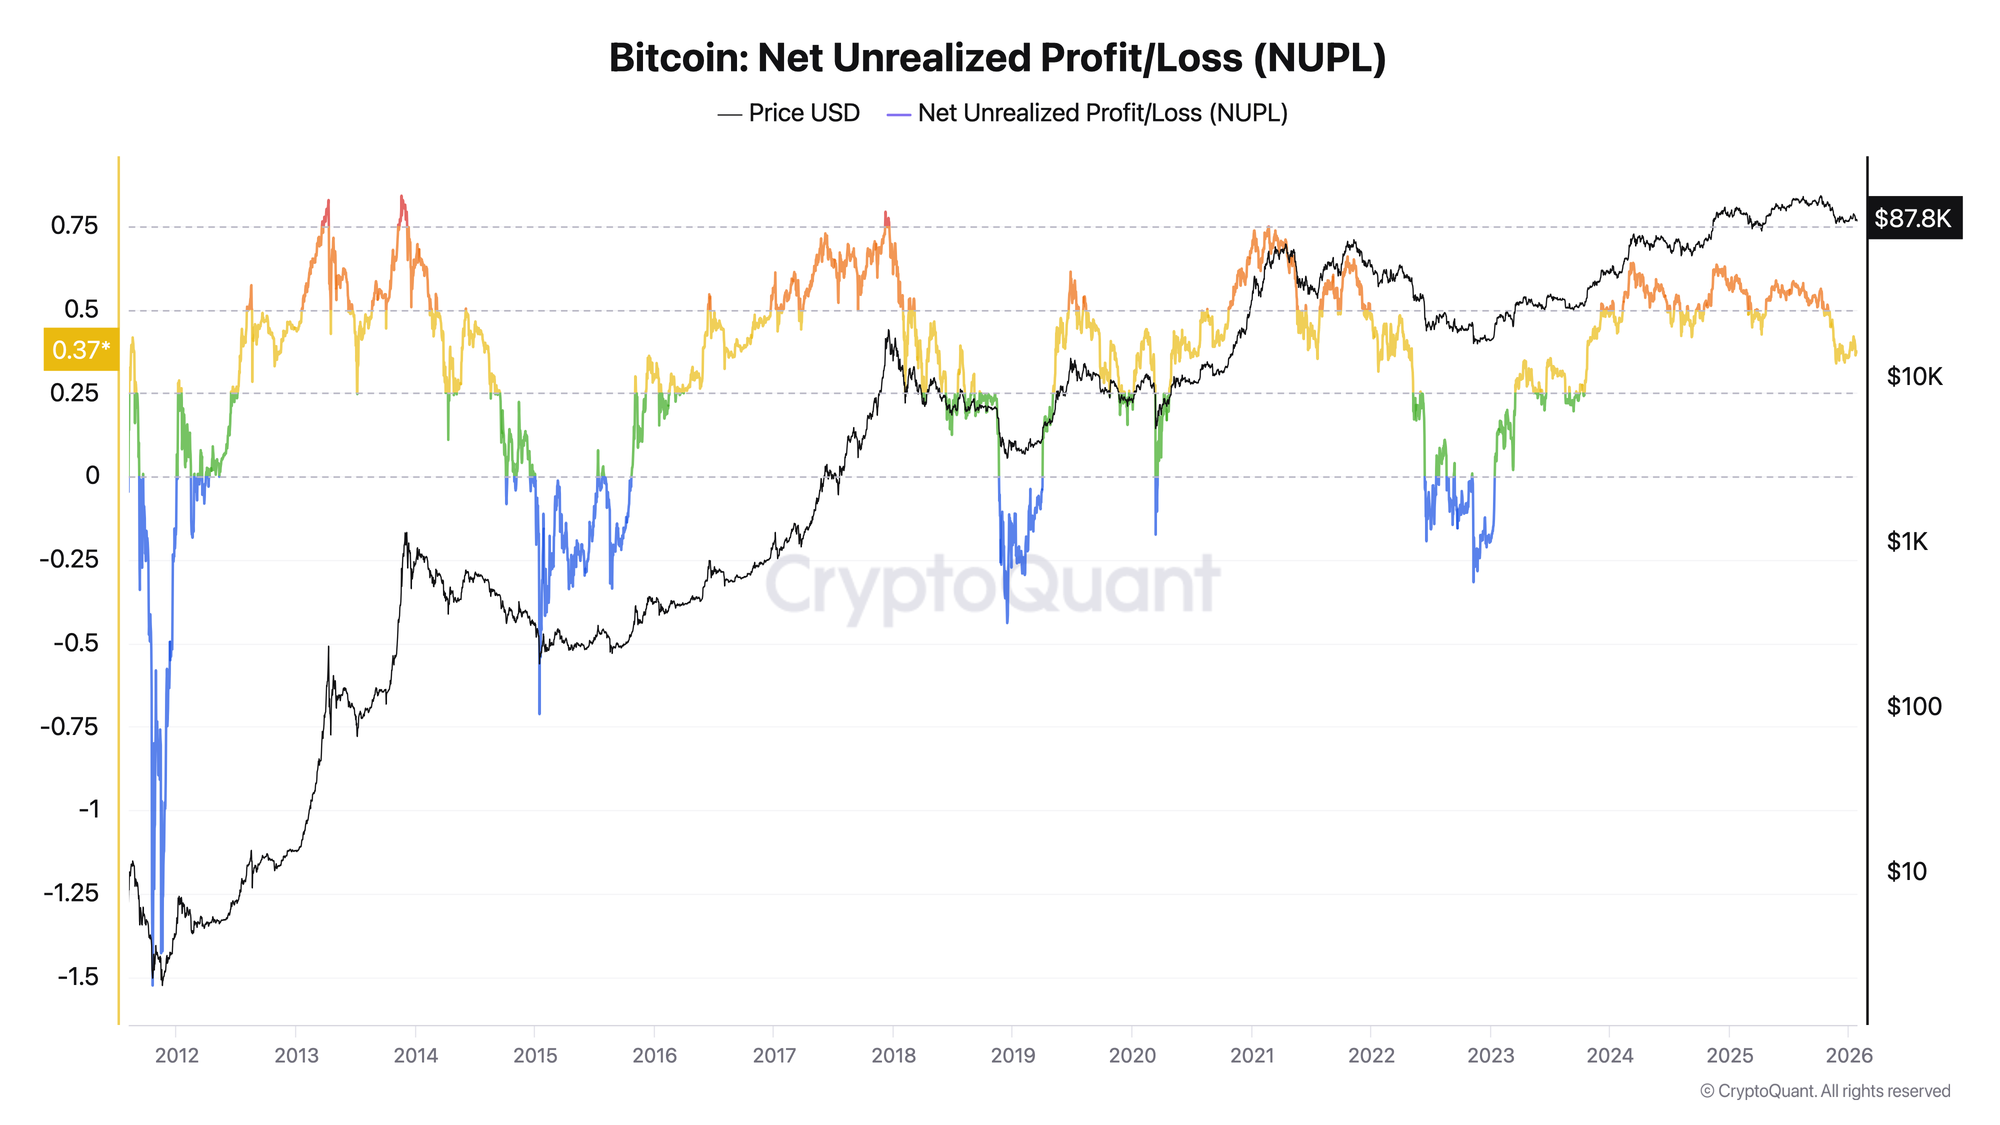
NUPL aggregates unrealized P/L across all coins:
NUPL = (Market Cap - Realized Cap) / Market Cap
Interpretation zones:

Historical peaks:
- April 9, 2013: NUPL = 0.828
- November 22, 2013: NUPL = 0.829
- December 16, 2017: NUPL = 0.783
- February 21, 2021: NUPL = 0.748
Realized Profit/Loss (Flow Metric)

Unlike NUPL (state metric), Realized P/L measures flow - how much profit or loss is being locked in per day/week.
Trading signals:
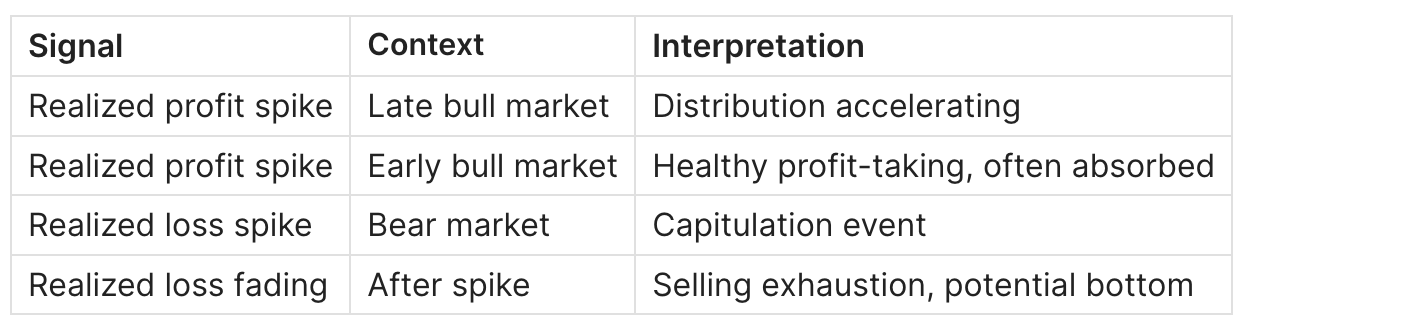
SOPR (Spent Output Profit Ratio)
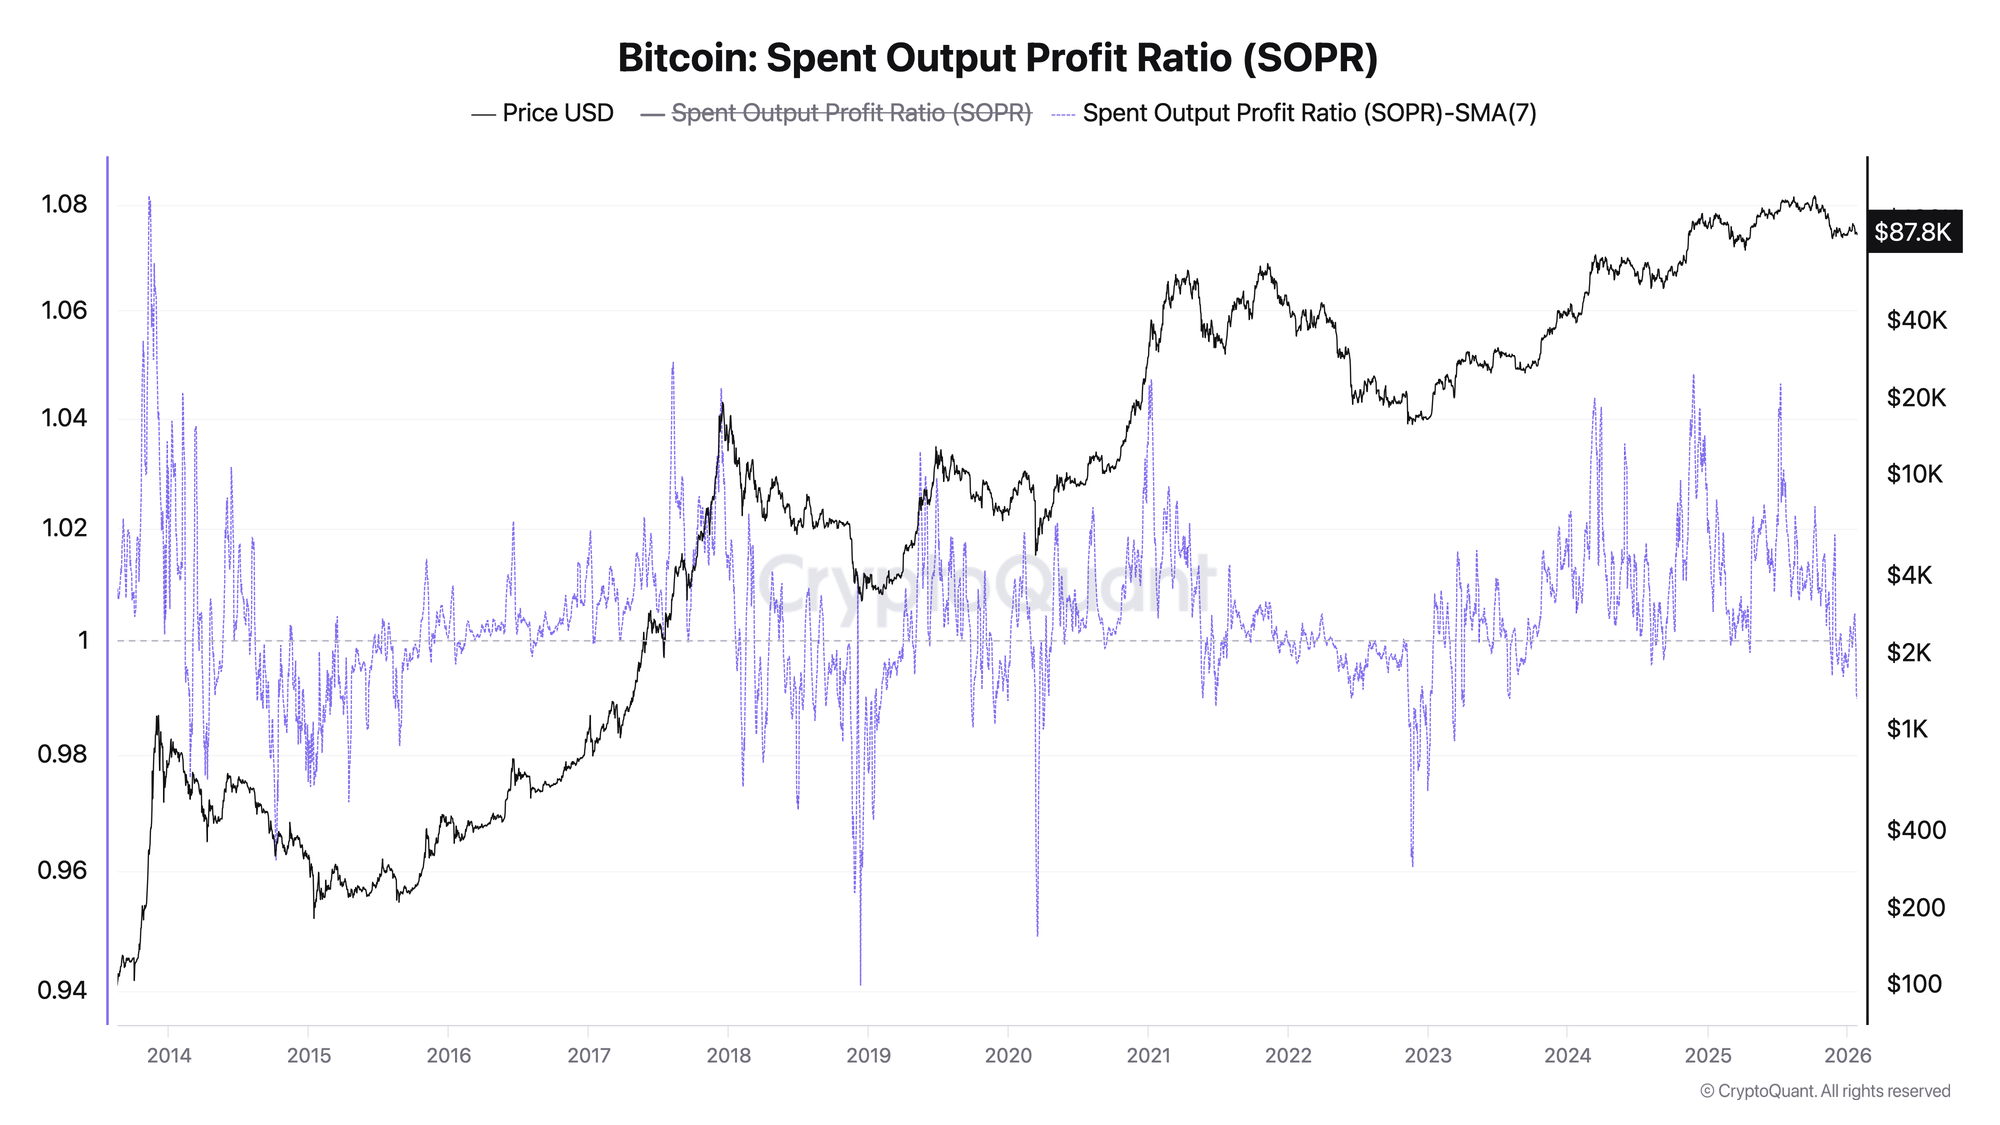
SOPR measures whether coins are being spent at profit or loss:
SOPR = Realized Value of Spent Outputs / Value at Creation
- SOPR > 1: Coins spent at profit (realized gains)
- SOPR < 1: Coins spent at loss (realized losses)
- SOPR = 1: Break-even, key support/resistance level
Supply in Profit
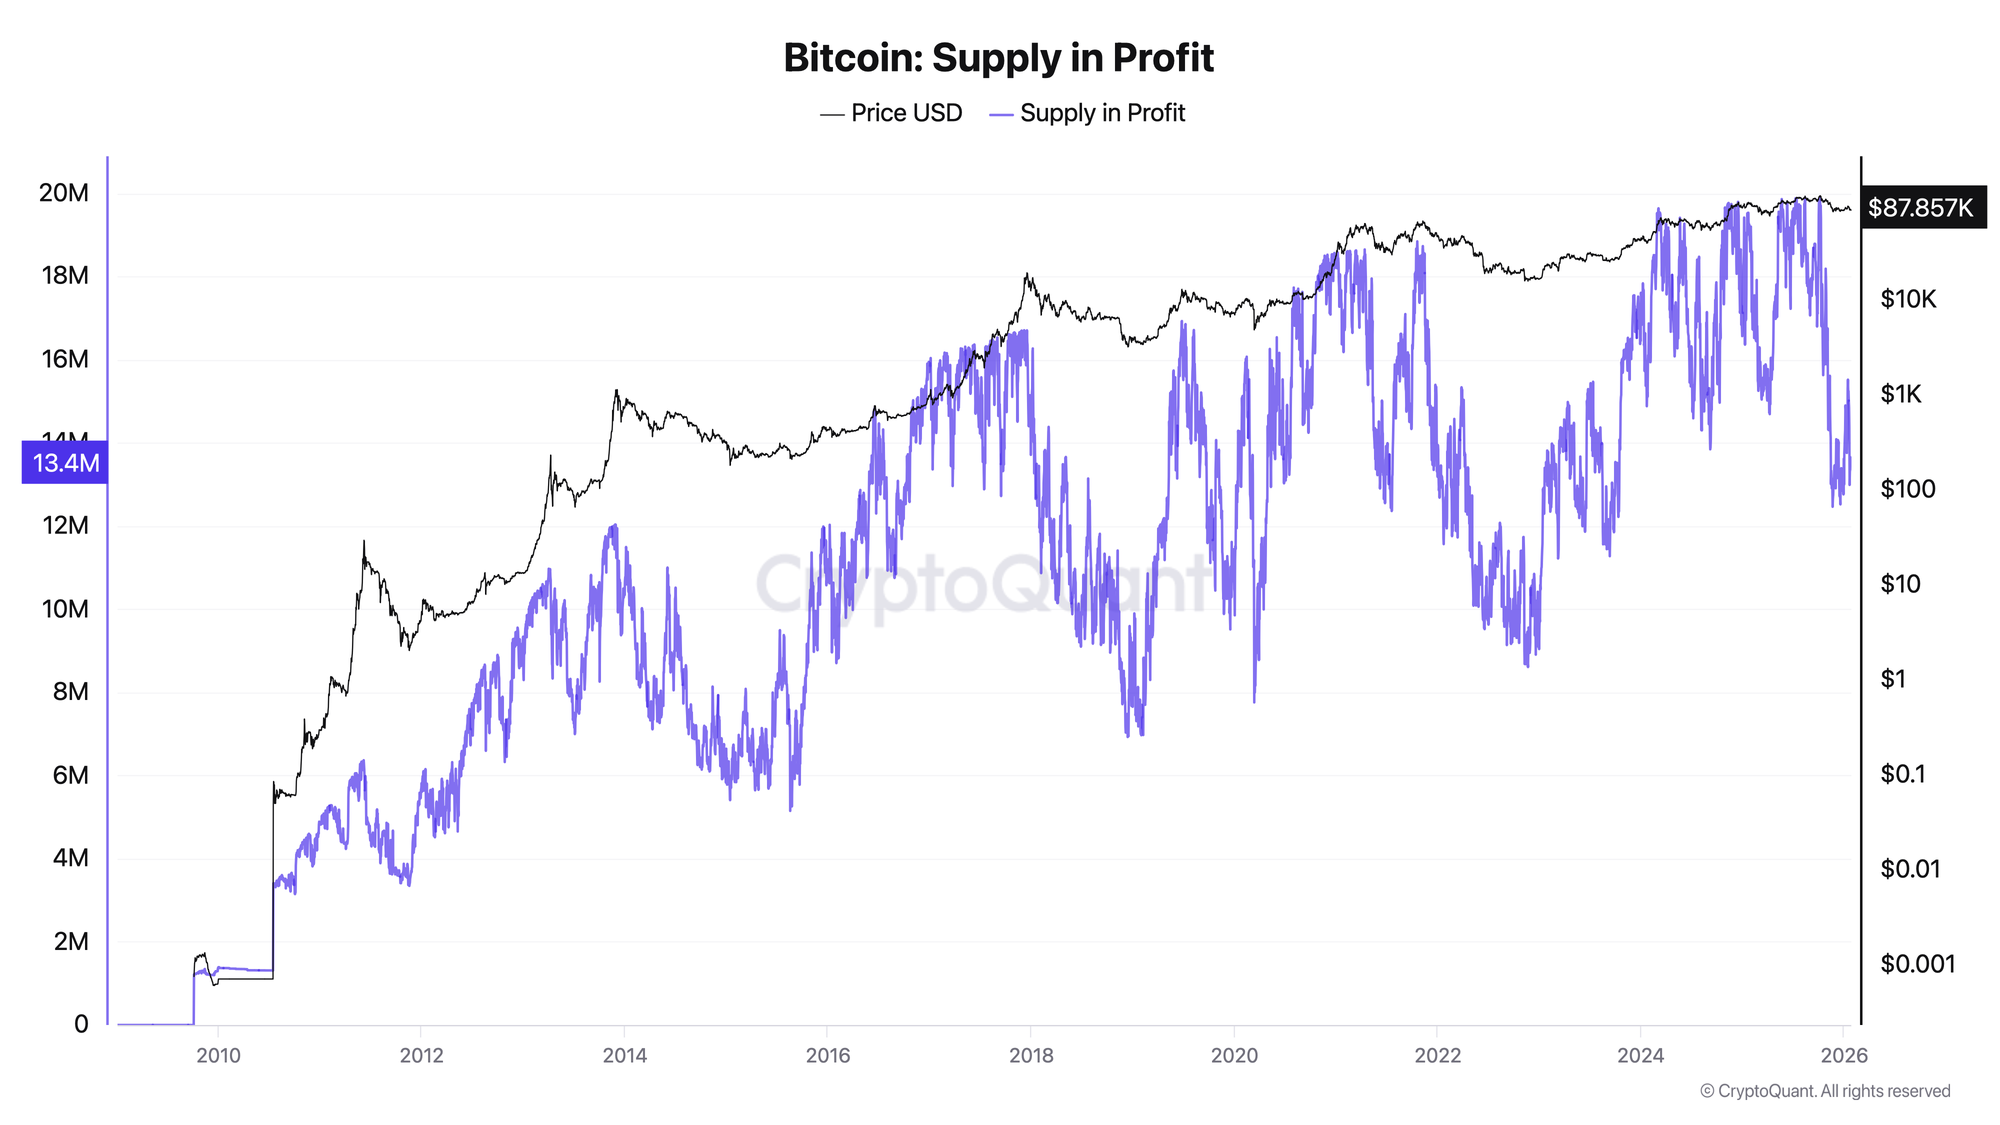
Percentage of circulating supply currently in unrealized profit:
Supply in Profit % = (Coins with cost basis < current price) / Total Supply
Critical thresholds:
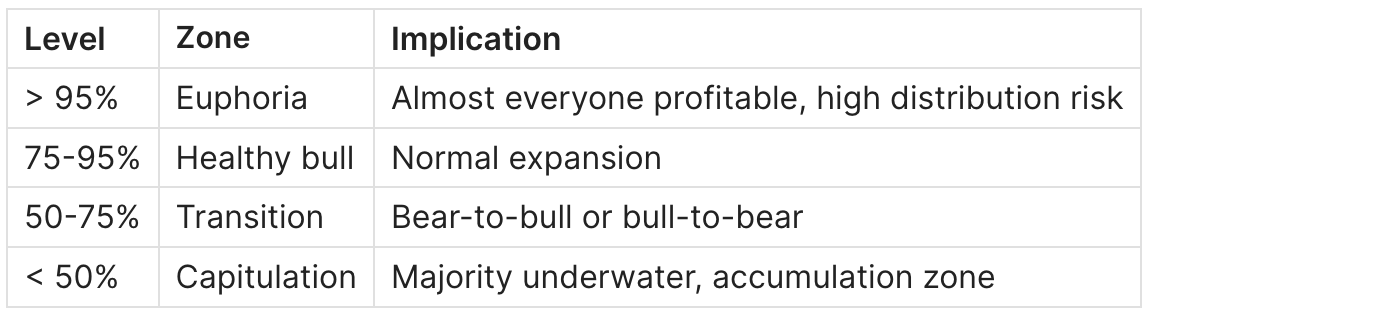
Current reading (January 2026): ~68% of supply in profit
Practical Trading Applications
Signal #1: Realized Profit Spikes at Cycle Tops
What to watch:
- Sustained realized profit above historical averages
- Accompanied by elevated NUPL (>0.6)
- Exchange inflows rising
How to act:
- Reduce risk exposure
- Tighten stop losses
- Scale out positions incrementally
Historical pattern: In late 2017 and early 2021, realized profit spiked as NUPL exceeded 0.7, preceding major corrections.
Signal #2: Unrealized Profit Near ATH
Warning signs when unrealized profit is extreme:
- Minor price drops trigger panic selling
- Market becomes fragile
- Small events cause outsized reactions
Confirmation signals:
- STH SOPR breaking below 1.0
- Exchange inflows increasing
- Funding rates extremely positive
Signal #3: Mass Unrealized Losses (Accumulation Zone)
Bottom formation requirements:
- NUPL negative or near zero
- Realized losses spiking then fading
- Price stabilization despite negative sentiment
- Long-term holder accumulation resuming
Historical validation: Every major Bitcoin bottom (2015, 2018, 2020, 2022) showed this pattern - unrealized losses peaked, realized losses spiked in capitulation, then faded as selling exhausted.
Combining Signals: The Profit Cycle Framework
Phase 1: Accumulation
- NUPL: Negative to slightly positive
- Realized P/L: Losses fading
- Supply in Profit: 40-60%
- Action: Accumulate
Phase 2: Expansion
- NUPL: Rising (0.25-0.5)
- Realized P/L: Moderate profit-taking
- Supply in Profit: 70-85%
- Action: Hold core, add on dips
Phase 3: Euphoria
- NUPL: High (>0.6)
- Realized P/L: Profit spikes
- Supply in Profit: >90%
- Action: Scale out, reduce risk
Phase 4: Distribution
- NUPL: Declining from highs
- Realized P/L: Heavy profit realization
- Supply in Profit: Falling
- Action: Defensive positioning
Phase 5: Capitulation
- NUPL: Near zero or negative
- Realized P/L: Loss spikes
- Supply in Profit: <60%
- Action: Prepare for accumulation
Common Confusion Points
"Transfer = Sale" in On-Chain Data
On-chain analysis sees all spending equally - whether it's:
- Actual sale on exchange
- Moving to cold storage
- Consolidating wallets
- Internal exchange transfers
Solution: Use entity-adjusted metrics and exchange flow filters to separate economic activity from housekeeping.
Realized Cap ≠ Realized Profit
These are related but different concepts:

Realized Cap is a valuation baseline. Realized Profit measures activity.
Unrealized ≠ Unrealizable
Just because profit is unrealized doesn't mean it can't be realized. The distinction matters because:
- Unrealized profit creates potential selling pressure
- Realized profit represents actual selling pressure
- High unrealized profit signals fragility, not certainty
Current Market Context
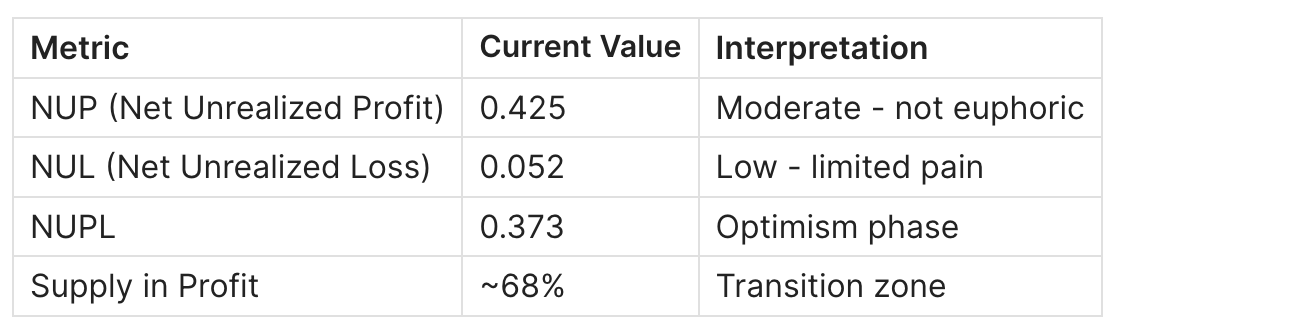
Reading: Market sits in the "Optimism" phase - neither euphoric nor fearful. This typically precedes either continued expansion or consolidation, depending on demand persistence.
What to monitor:
- NUPL movement toward 0.5+ would signal strengthening bull
- Drop below 0.25 would suggest weakening momentum
- Exchange netflow direction for distribution/accumulation signals
FAQ
Do I pay taxes on unrealized profit?
In most jurisdictions, unrealized profit is not a taxable event. Taxes typically apply when you realize gains by selling, trading, or spending crypto. However, rules vary by country - some jurisdictions may tax unrealized gains in specific circumstances. Always consult a tax professional for your specific situation.
How do I track my personal unrealized profit?
Portfolio tracking tools (CoinTracking, Koinly, CoinGecko Portfolio) calculate unrealized P/L based on your purchase history and current prices. For on-chain metrics like NUPL, use Glassnode, CryptoQuant, or free alternatives like LookIntoBitcoin.
What happens to unrealized profit when price drops?
It compresses or converts to unrealized loss. This changes holder behavior incentives:
- Holders still in profit may hold, waiting for recovery
- Holders flipping to loss may panic sell (capitulation)
- New buyers enter at lower cost basis, changing market dynamics
Is high unrealized profit bullish or bearish?
Both. It supports confidence (holders feel wealthy) but increases fragility (incentive to lock in gains rises). The key is the rate of change - rapid increases in unrealized profit followed by stagnation often precede corrections. Sustained high unrealized profit with continued demand absorption is bullish.
What's the relationship between NUPL and Supply in Profit?
Both measure unrealized state, but differently:
- NUPL weights by value (larger positions matter more)
- Supply in Profit counts coins equally (democratic measure)
They typically move together but can diverge when large holders (whales) have different cost bases than retail. For example, if whales bought low and retail bought high, Supply in Profit may be low while NUPL remains elevated.
Can these metrics predict exact tops and bottoms?
No. They identify risk zones, not precise timestamps. Markets can remain at extremes longer than expected - 2013 saw NUP above 0.80 for several weeks. Always combine with other indicators (MVRV, SOPR, Exchange Flows) and practice proper risk management.
How quickly does unrealized become realized in a selloff?
Very quickly. During panic events (March 2020, November 2022), realized losses spiked within days as holders rushed to exit. The speed of realization often indicates the severity of capitulation - faster spikes typically mark sharper bottoms.
Why does NUPL sometimes stay negative for extended periods?
Extended negative NUPL indicates prolonged bear markets where price remains below aggregate cost basis. This occurred in 2014-2015 and 2018-2019. These periods represent accumulation phases for patient investors - historically, buying during extended negative NUPL has produced strong returns.
Related Metrics
Build a complete framework by understanding these connected concepts:
- Bitcoin NUPL: What It Is and How to Use It
- Bitcoin STH SOPR: What It Is and How to Use It
- Bitcoin MVRV Ratio: Definition, Formula & Cycle Signals
- Bitcoin Exchange Netflow: What It Is and How to Use It
- Bitcoin LTH vs STH: Supply Dynamics & Market Structure
- Bitcoin Realized Price Bands Explained
Key Takeaways
- Unrealized profit is potential - it exists on paper until coins move
- Realized profit is confirmed - it impacts market through actual selling
- NUPL aggregates unrealized state - key sentiment indicator
- Realized P/L measures flow - shows distribution/accumulation in real-time
- Extreme unrealized profit signals fragility - not guaranteed top, but elevated risk
- Combine metrics for confirmation - no single indicator is sufficient
Advanced Interpretation: NUP vs NUL Dynamics
For deeper analysis, examine Net Unrealized Profit (NUP) and Net Unrealized Loss (NUL) separately rather than just their difference (NUPL).
When Both NUP and NUL Are Low
Indicates market consolidation near aggregate cost basis. Most participants are near break-even - a neutral state that can resolve in either direction.
When NUP Is High, NUL Is Low
Classic bull market condition - almost everyone is profitable. This is sustainable during expansion but becomes fragile at extremes.
When NUL Is High, NUP Is Moderate
Bear market condition - significant portion of market underwater. Watch for NUL peaks followed by decline, signaling capitulation completion.
Rate of Change Matters
- Rising NUP + stable NUL = healthy bull expansion
- Falling NUP + rising NUL = bear market developing
- Spiking NUL = acute capitulation event (often marks bottoms)
- NUP/NUL ratio extremes = regime change likely