
USDT and USDC market capitalization measures the total dollar value of stablecoins in circulation - the combined dry powder available to buy risk assets on-chain. When this supply expands rapidly, it signals capital entering the crypto ecosystem before it deploys into Bitcoin. When it contracts, it often reflects profit-taking or risk-off rotation out of the market entirely.
TL-DR
- What it is: total circulating supply of USDT or USDC multiplied by $1 peg - the on-chain dollar reserve
- How it is calculated:
Stablecoin Market Cap = Circulating Supply x $1.00- tracked via Tether/Circle attestations and verified on-chain - What "up" means: fresh capital printed and sitting on-chain, buyers are loading up before deploying into BTC
- What "down" means: stablecoins redeemed or burned - capital exiting the ecosystem, bearish for near-term BTC demand
- 30d change is the key derivative: the rate of supply growth (or contraction) over 30 days shows whether the trend is accelerating or slowing
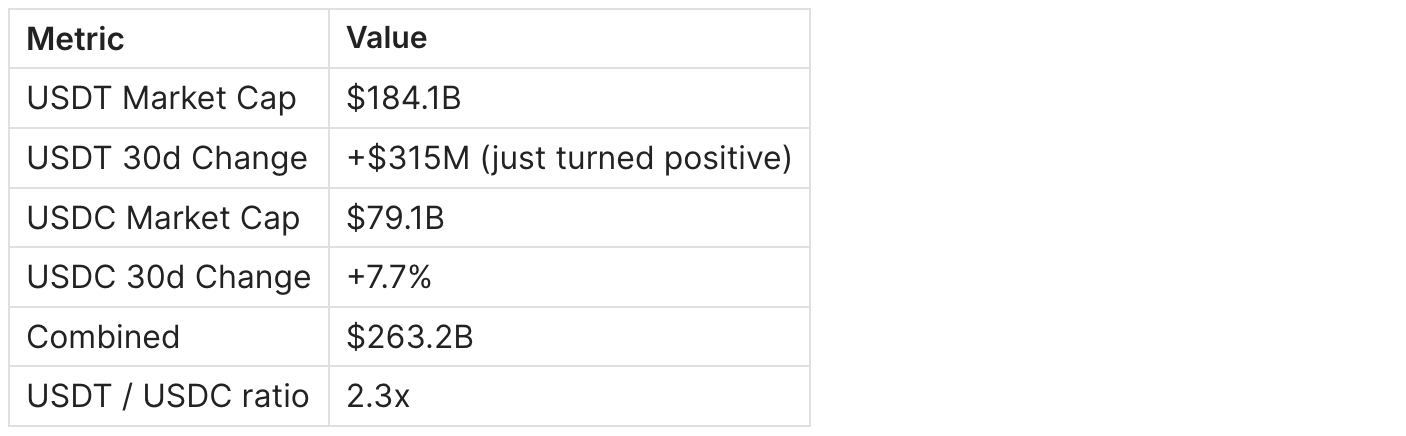
- Main practical signal: USDT 30d change flipping from negative to positive (-$315M as of March 2026) confirms a demand-side inflection point
- Caveat: stablecoin growth can be driven by institutional reserve management, DeFi yield farming, or macro dollar demand - not always pure BTC buying intent
Signal rule: when combined USDT + USDC 30d supply growth turns positive after a contraction period lasting 30 or more days, monitor for a BTC breakout within 2-6 weeks.
The Signal Rule
The core idea is simple: stablecoins are the fuel. Bitcoin is the engine. You watch the fuel tank.
Formula:
USDT 30d Change = USDT Market Cap (today) - USDT Market Cap (30 days ago)
USDC 30d Change% = (USDC Market Cap (today) / USDC Market Cap (30 days ago) - 1) x 100
Current readings (March 15, 2026):
Interpretation:
- Bullish: USDT 30d change positive and accelerating + USDC 30d% above +5%
- Bearish: USDT 30d change deeply negative (below -$2B/month) + USDC 30d% negative
- Neutral: USDT 30d change oscillating around zero + USDC flat
If X, then Y:
- If USDT 30d change turns positive after 30+ consecutive days of contraction - expect BTC to find a floor or stage a relief rally within 2-4 weeks
- If USDT 30d change drops below -$3B and USDC 30d% falls below -5% simultaneously - expect BTC selling pressure to persist
Key Definitions
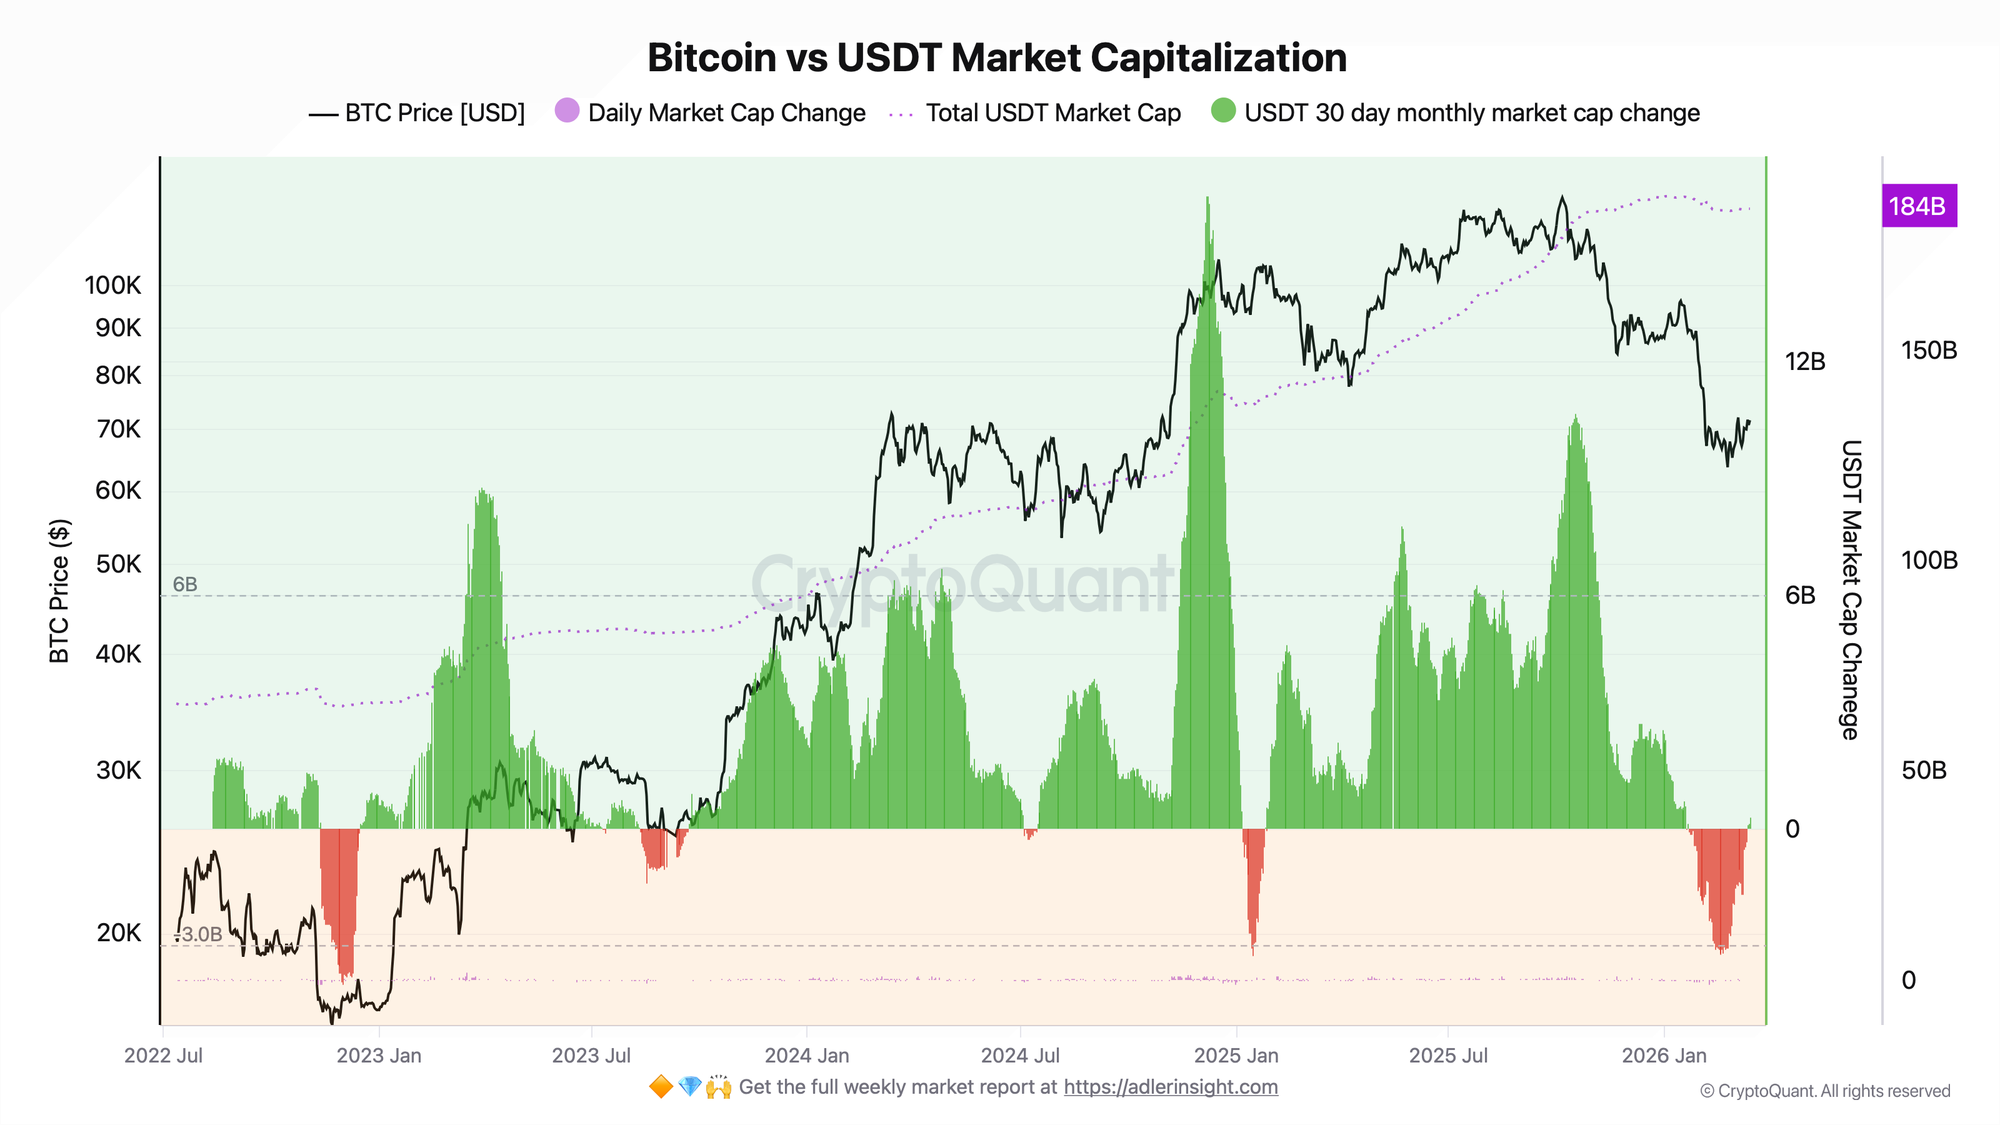
USDT (Tether): the largest stablecoin by market cap at $184.1B as of March 2026, issued by Tether Ltd. Dominant in OTC, emerging markets, and centralized exchange trading pairs. Backed by a mix of US Treasuries, repo agreements, and other assets.
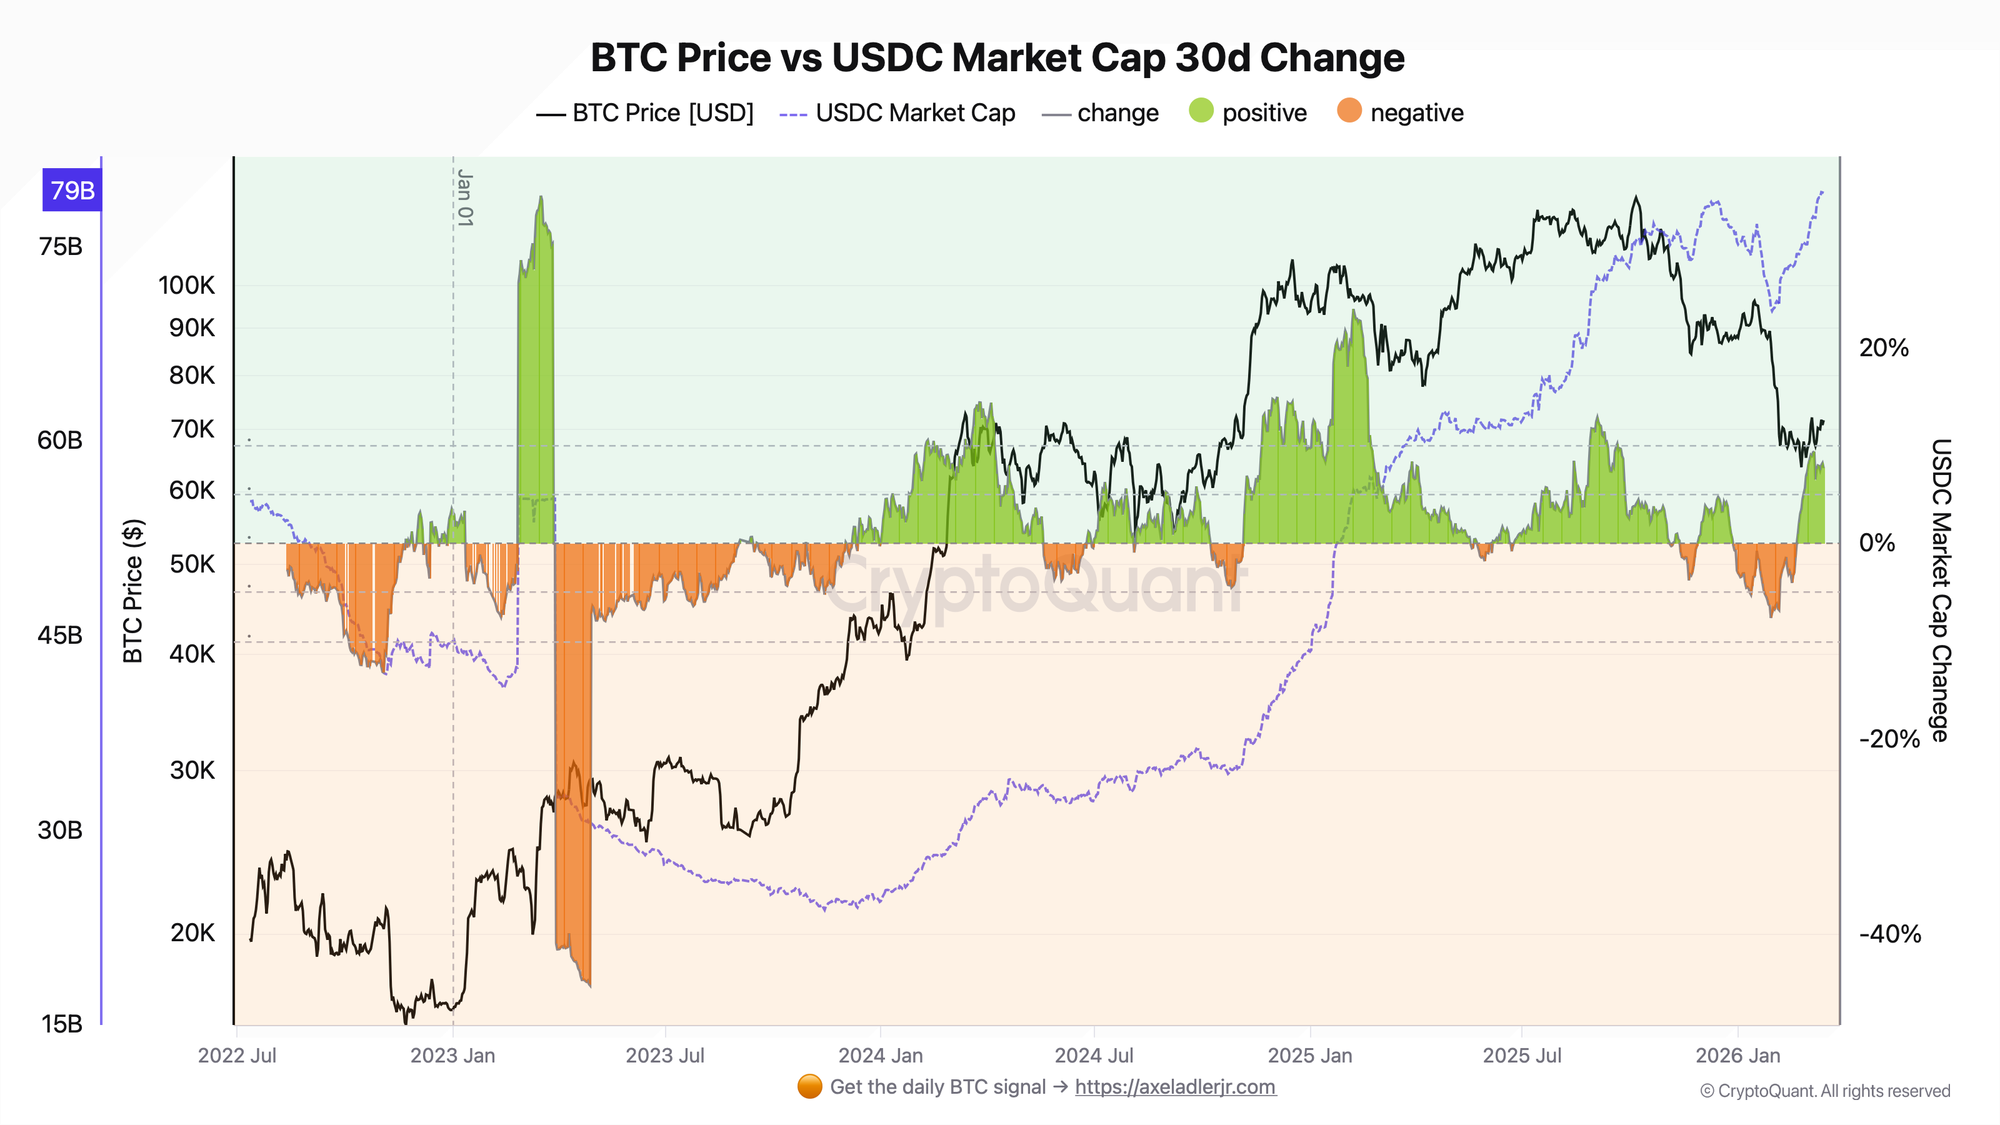
USDC (USD Coin): issued by Circle, currently at $79.1B. Preferred by US institutional players and DeFi protocols. Fully backed by cash and short-term US Treasuries with monthly Deloitte attestations. Grew 73% in 2025 vs USDT's 36% - closing the gap.
30d Change (absolute): the net issuance or redemption of USDT in dollar terms over a rolling 30-day window. Used for USDT because absolute size matters - a $1B issuance on a $184B base is a very different signal than the same amount on a $65B base.
30d Change% (relative): percentage change in USDC supply over 30 days. Preferred for USDC because its growth rate is more volatile and relative acceleration is more analytically useful.
Stablecoin Supply Ratio (SSR): Bitcoin market cap divided by total stablecoin market cap. A low SSR means stablecoins have high relative purchasing power over BTC - historically bullish.
How to Interpret This Metric
Bullish case
New stablecoin supply is being printed (minted) and sitting on exchanges or in wallets - not yet deployed. This is latent buying pressure. The longer the accumulation period before deployment, the sharper the eventual BTC move. USDT 30d just crossed from -$3.2B at peak contraction (Feb 17, 2026) to +$315M (March 15, 2026) - a +$3.5B swing in under 30 days. BTC moved from $63.7K to $71.6K during the same window.
Bearish case
Large stablecoin redemptions (burns) signal capital leaving the ecosystem. When USDT 30d was running at -$3.1B+ in mid-February 2026, BTC price was under pressure in the $63K-$68K range. Similarly, when USDC 30d% dropped to -45.1% at its historical low (2022-2023 bear market), BTC was at or near cycle bottom. Both metrics contracting together is the highest-conviction bearish signal.
Neutral case
Oscillation around zero for USDT 30d change, with USDC 30d% between -2% and +3%. This suggests capital recycling rather than fresh inflows or outflows. BTC tends to chop sideways during these periods.
What matters most
Trend over single readings. A single day of positive USDT 30d change after a prolonged contraction is more significant than a large one-off mint. Watch for 3-5 consecutive days of positive readings to confirm a regime shift. The 30d window smooths out Tether's lumpy mint/burn schedule (large institutional batches).
Historical Examples
Historical examples (what worked, what didn't)
Example 1: Bear market bottom - USDC at $23.9B (November 2023)
USDC market cap hit its cycle low of $23.9B on November 14, 2023, with BTC at $36.3K. This represented a -45.1% drawdown from USDC's prior peak - capital had left the ecosystem entirely during the 2022-2023 bear. As USDC began recovering and USDT 30d change stabilized from deeply negative to flat, BTC began its sustained recovery from $36K toward $69K ATH by March 2024. The signal here was not one big day - it was the inflection from contraction to stabilization.
Example 2: USDT peak - $187.2B (December 30, 2025)
USDT hit its cycle high of $187.2B with BTC at $87.9K. Notably, after that peak, USDT 30d change went negative and stayed deeply negative (-$2.5B to -$3.2B) through February 2026 - the period when BTC pulled back from $89K toward $63K. The stablecoin contraction was a leading indicator of the correction, not a lagging one. Capital was leaving the ecosystem before BTC price confirmed the full drawdown.
Example 3: USDT low - $65.3B (July 2022, bear market floor)
When USDT was at its bear cycle low of $65.3B, the market was in deep capitulation. Recovery in stablecoin supply over the following quarters preceded BTC's recovery by 4-8 weeks on each mini-cycle. The relationship is not perfectly timed but directionally robust: supply growth precedes BTC price recovery.
How to Use It in Practice
Setup
Monitor daily: USDT 30d absolute change, USDC 30d%, and the trend direction (3-day moving average of each).
Trigger
USDT 30d change crosses from negative to positive AND holds positive for 3 or more consecutive days. USDC 30d% above +5%.
Confirm
Cross-reference with:
- Bitcoin Exchange Netflow - net outflow from exchanges confirms HODLer accumulation alongside stablecoin growth
- Bitcoin STH SOPR above 1.0 - short-term holders back in profit, reducing sell pressure
- Bitcoin MVRV Ratio below 2.0 - market not overvalued, room for new stablecoin capital to push price higher
Invalidates when
USDT 30d change turns negative again within 5 days of a bullish signal, or combined stablecoin supply drops more than 2% in a week. This suggests the mint was a one-off institutional event, not a genuine demand wave.
Action
On confirmed signal with 2 of 3 confirmations above: increase BTC exposure on a 4-8 week horizon. Use STH Realized Price as a key support level to size risk.
Time horizon: stablecoin market cap is a medium-term indicator (weeks to months), not a day-trading signal. False positives are common on 1-3 day readings.
Common Pitfalls
1. Confusing issuance with deployment Tether mints stablecoins in large batches on Tron and Ethereum - often $1-3B at a time - before they are sent to exchanges. A single large mint can show up as a bullish signal before any actual buying occurs. Filter: look for sustained growth over 5-7 days, not a single-day spike in issuance.
2. Ignoring the USDT / USDC split USDT dominates emerging markets and OTC; USDC dominates US institutional and DeFi. During periods of regulatory uncertainty (2022-2023), USDC contracted while USDT grew - this was a jurisdiction-specific signal, not a pure BTC demand signal. Always read both together. The current USDT/USDC ratio is 2.3x, near its historical norm.
3. Post-ETF era: institutional demand for stablecoins is no longer purely crypto-native Since Bitcoin spot ETFs launched in January 2024, some large stablecoin flows are driven by settlement for ETF arbitrage, not direct BTC buying. A growing USDT market cap does not automatically translate to on-chain BTC demand if the capital stays within TradFi settlement rails. Cross-check with Bitcoin Open Interest to confirm whether crypto-native leverage is building.
4. 30d change as a rate, not a level USDT going from $187B to $184B is a $3B contraction - bearish. But if it was at $65B one year ago, the absolute level is still very high. Use 30d change as a rate-of-change signal, not the absolute level. The level tells you ecosystem size; the rate tells you current direction.
5. Macro-driven stablecoin demand In 2024-2025, emerging market dollar demand (particularly for USDT in Latin America, Middle East, and Southeast Asia) inflated stablecoin supply without any connection to BTC buying intent. USDT's role as a dollar substitute in high-inflation economies means global M2 and DXY context matters.
6. Burn events masking true supply September 2025 saw coordinated burn events of $9B+ weekly for both USDC and USDT - driven by institutional supply management, not capital exit. These events can create misleading 30d change readings. Check whether mint volumes have also increased in parallel before concluding capital is leaving.
Stablecoin Market Cap vs Stablecoin Supply Ratio (SSR)
These two metrics answer different questions:
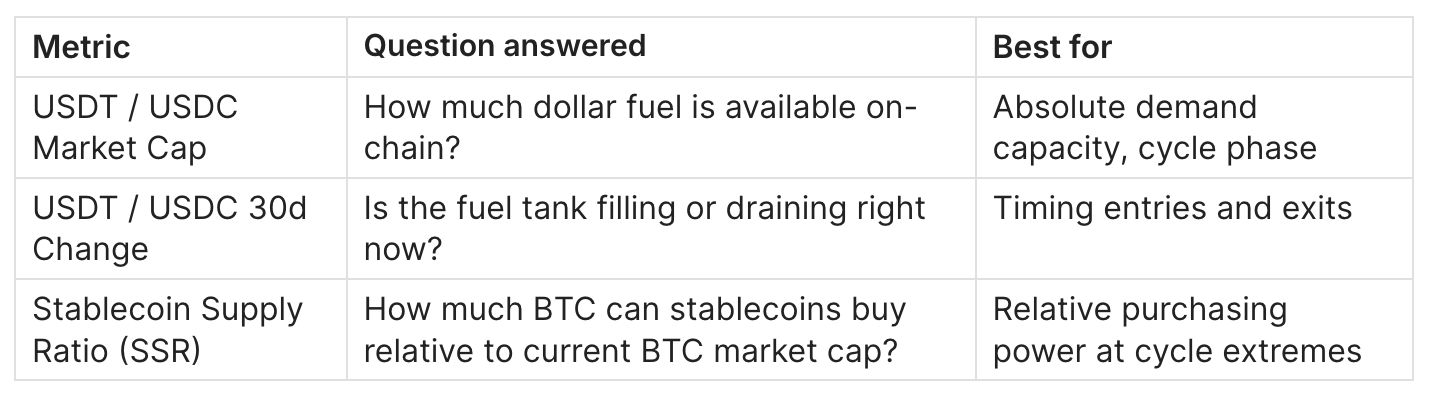
Use market cap + 30d change for regime detection. Use SSR when you want to assess relative purchasing power at potential tops and bottoms. A low SSR (stablecoins large relative to BTC market cap) combined with expanding 30d stablecoin supply is the highest-conviction bullish combination.
FAQ
Q: What is a significant USDT 30d change value? A: Based on the 2022-2026 dataset, a 30d change above +$2B/month is meaningfully bullish. A change below -$2B/month is meaningfully bearish. The range observed in this dataset runs from -$4.0B (bear market peak contraction) to +$16.3B (bull market peak expansion). Current +$315M is early-stage recovery - trending right but not yet at bull-mode levels.
Q: Where to find this data? A: CryptoQuant (market cap charts for USDT ERC20, USDT Tron, USDC), Glassnode Studio (USDT and USDC market cap metrics), DefiLlama (stablecoin dashboard with supply and peg data), and CoinMarketCap (stablecoin category rankings).
Q: Does USDC 30d% still work after the ETF launch? A: Yes, but with an adjustment. Post-ETF, USDC flows increasingly reflect institutional DeFi and settlement activity. USDC growing on Base and Ethereum (both up 46%+ since October 2024) signals institutional crypto-native demand, which is a strong BTC-bullish secondary signal. Weight USDC 30d% higher when Ethereum DeFi TVL is also growing.
Q: How do you filter out Tether's batch minting? A: Use a 7-day rolling average of daily mint/burn data instead of raw 30d change. Large single-day mints without corresponding exchange inflows are pre-positioning inventory, not deployed capital. CryptoQuant's Tether printing indicator separates on-exchange from off-exchange issuance.
Q: What happened to USDC during the 2023 SVB crisis? A: USDC briefly depegged to $0.87 in March 2023 when Circle disclosed $3.3B in reserves held at Silicon Valley Bank. Market cap contracted sharply as holders redeemed. USDC 30d% hit extreme negative readings during this period. The recovery to peg coincided with BTC bottoming and beginning its 2023 rally - an unusual case where a stablecoin crisis cleared out weak hands and set the stage for the bull run.
Q: Is USDT or USDC a better leading indicator for BTC? A: They serve different roles. USDT is the better raw demand indicator because it dominates exchange trading pairs and has higher total volume. USDC is a better institutional sentiment indicator because its growth reflects regulated, institutional capital flows. Use USDT for market-timing signals; use USDC trend as a macro regime filter.
Q: What is the USDT / USDC ratio telling us right now? A: At 2.3x (March 2026), the ratio is within normal range. During the peak of USDC's 2021-2022 growth phase, this ratio narrowed toward 1.5x. It widening back to 2.3x reflects USDC's 2022-2023 drawdown and partial recovery. USDC growing faster (73% in 2025 vs USDT's 36%) means the ratio is slowly compressing again - a sign of growing US institutional participation.
Q: Can stablecoin market cap predict exact BTC cycle tops? A: No. The peak of stablecoin issuance often precedes cycle tops by weeks, not the other way around. USDT peaked at $187.2B on December 30, 2025, when BTC was at $87.9K - not at BTC's cycle high. What it can flag is the post-peak contraction: sustained USDT 30d negative readings after a period of peak supply are a useful cycle-top confirmation, not a standalone predictor.
Related Guides
- Bitcoin Exchange Netflow: What It Is and How to Use It - combine with stablecoin supply to identify demand-side vs supply-side pressure
- Bitcoin NUPL (Net Unrealized Profit/Loss): What It Is and How to Use It - stablecoin expansion into a low-NUPL market is the most bullish macro setup
- Bitcoin MVRV Ratio: Definition, Formula & Cycle Signals - confirm whether stablecoin fuel has room to push BTC higher
- Bitcoin STH SOPR: What It Is and How to Use It - validate demand signal with short-term holder behavior
- Bitcoin Open Interest & Leverage Ratio - differentiate spot demand (stablecoin-driven) from derivatives-driven moves
- Bitcoin Open Interest and Funding Rate: The Combined Framework - high stablecoin growth + low funding rate = ideal setup before leveraged breakout
- Spot ETFs and Global M2: Thresholds for Overriding the Bitcoin Halving Cycle - macro liquidity context for interpreting stablecoin demand signals
- Bitcoin LTH vs STH: Supply Dynamics, Cost Basis & Market Structure - understand who is absorbing new stablecoin-driven demand
Conclusion
- USDT and USDC market capitalization is on-chain dry powder - a direct measure of dollar capital available to deploy into Bitcoin
- The 30d change derivative is the operative signal: direction and rate of supply growth tells you whether the ecosystem is in accumulation or distribution mode
- As of March 2026, USDT 30d just turned positive (+$315M) after a sustained -$3B+ contraction, while USDC 30d% has been positive for 23 consecutive days at +7.7% - an early-stage bullish inflection that warrants attention but not yet confirmation
Next step: read Bitcoin Exchange Netflow to understand whether the stablecoin supply growth is matching exchange inflows - the combination of both is the highest-conviction demand confirmation.