
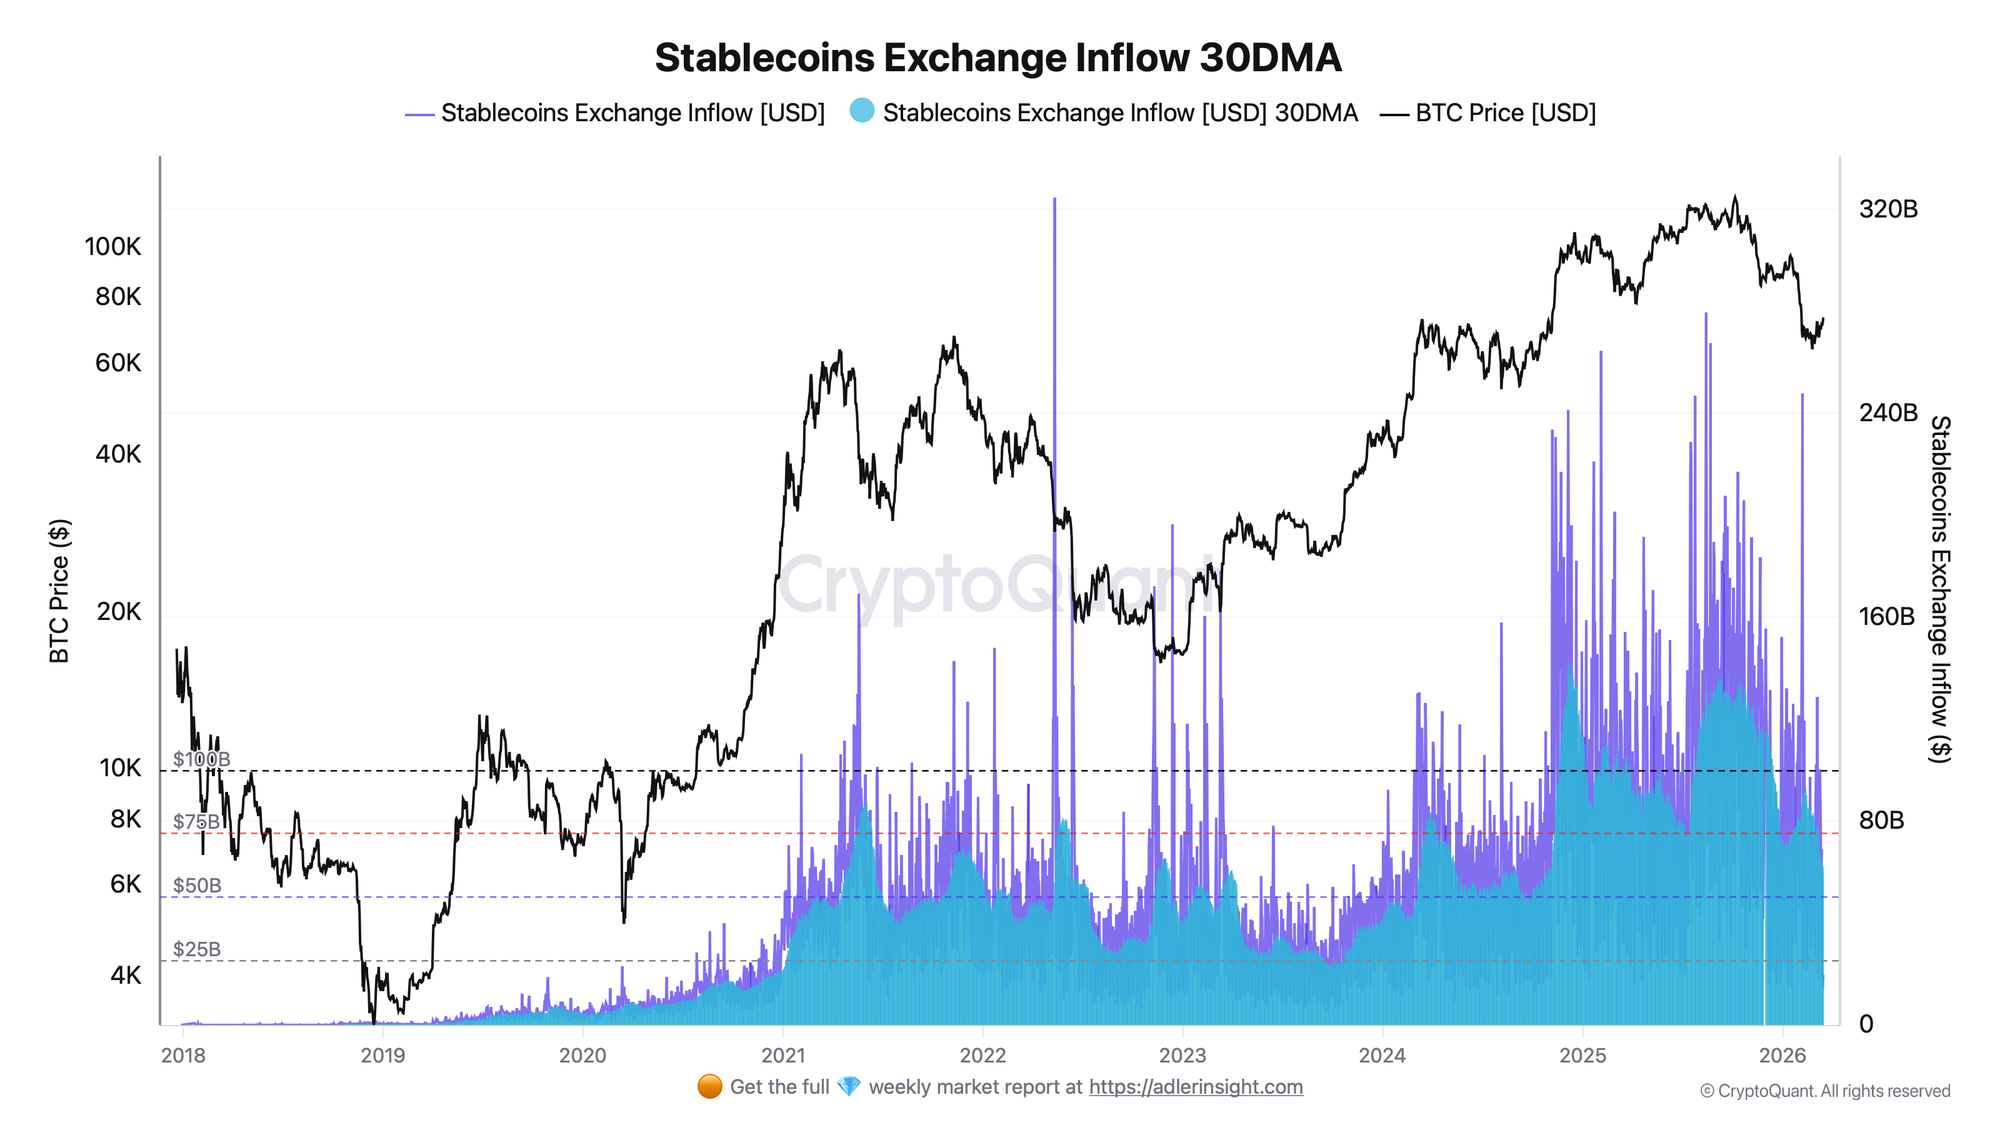
Stablecoins Exchange Inflow tracks how much USDT, USDC, and other dollar-pegged assets are deposited onto crypto exchanges per day. Because stablecoins are the primary vehicle traders use to buy Bitcoin, a rising inflow trend means demand-side ammunition is loading - making this one of the clearest leading indicators of incoming buy pressure in any cycle phase.
TL-DR
- What it is: the daily USD value of stablecoins deposited into exchange wallets (spot + derivatives)
- How it is measured: on-chain transfers from external wallets to labeled exchange addresses, sourced from CryptoQuant
- 30DMA: 30-day moving average of the raw daily figure - removes weekend noise and wash-trading spikes
- Rising 30DMA = bullish: dry powder building on exchanges, buy pressure incoming
- Falling 30DMA = bearish / neutral: capital leaving the system or being deployed (watch exchange reserve to confirm)
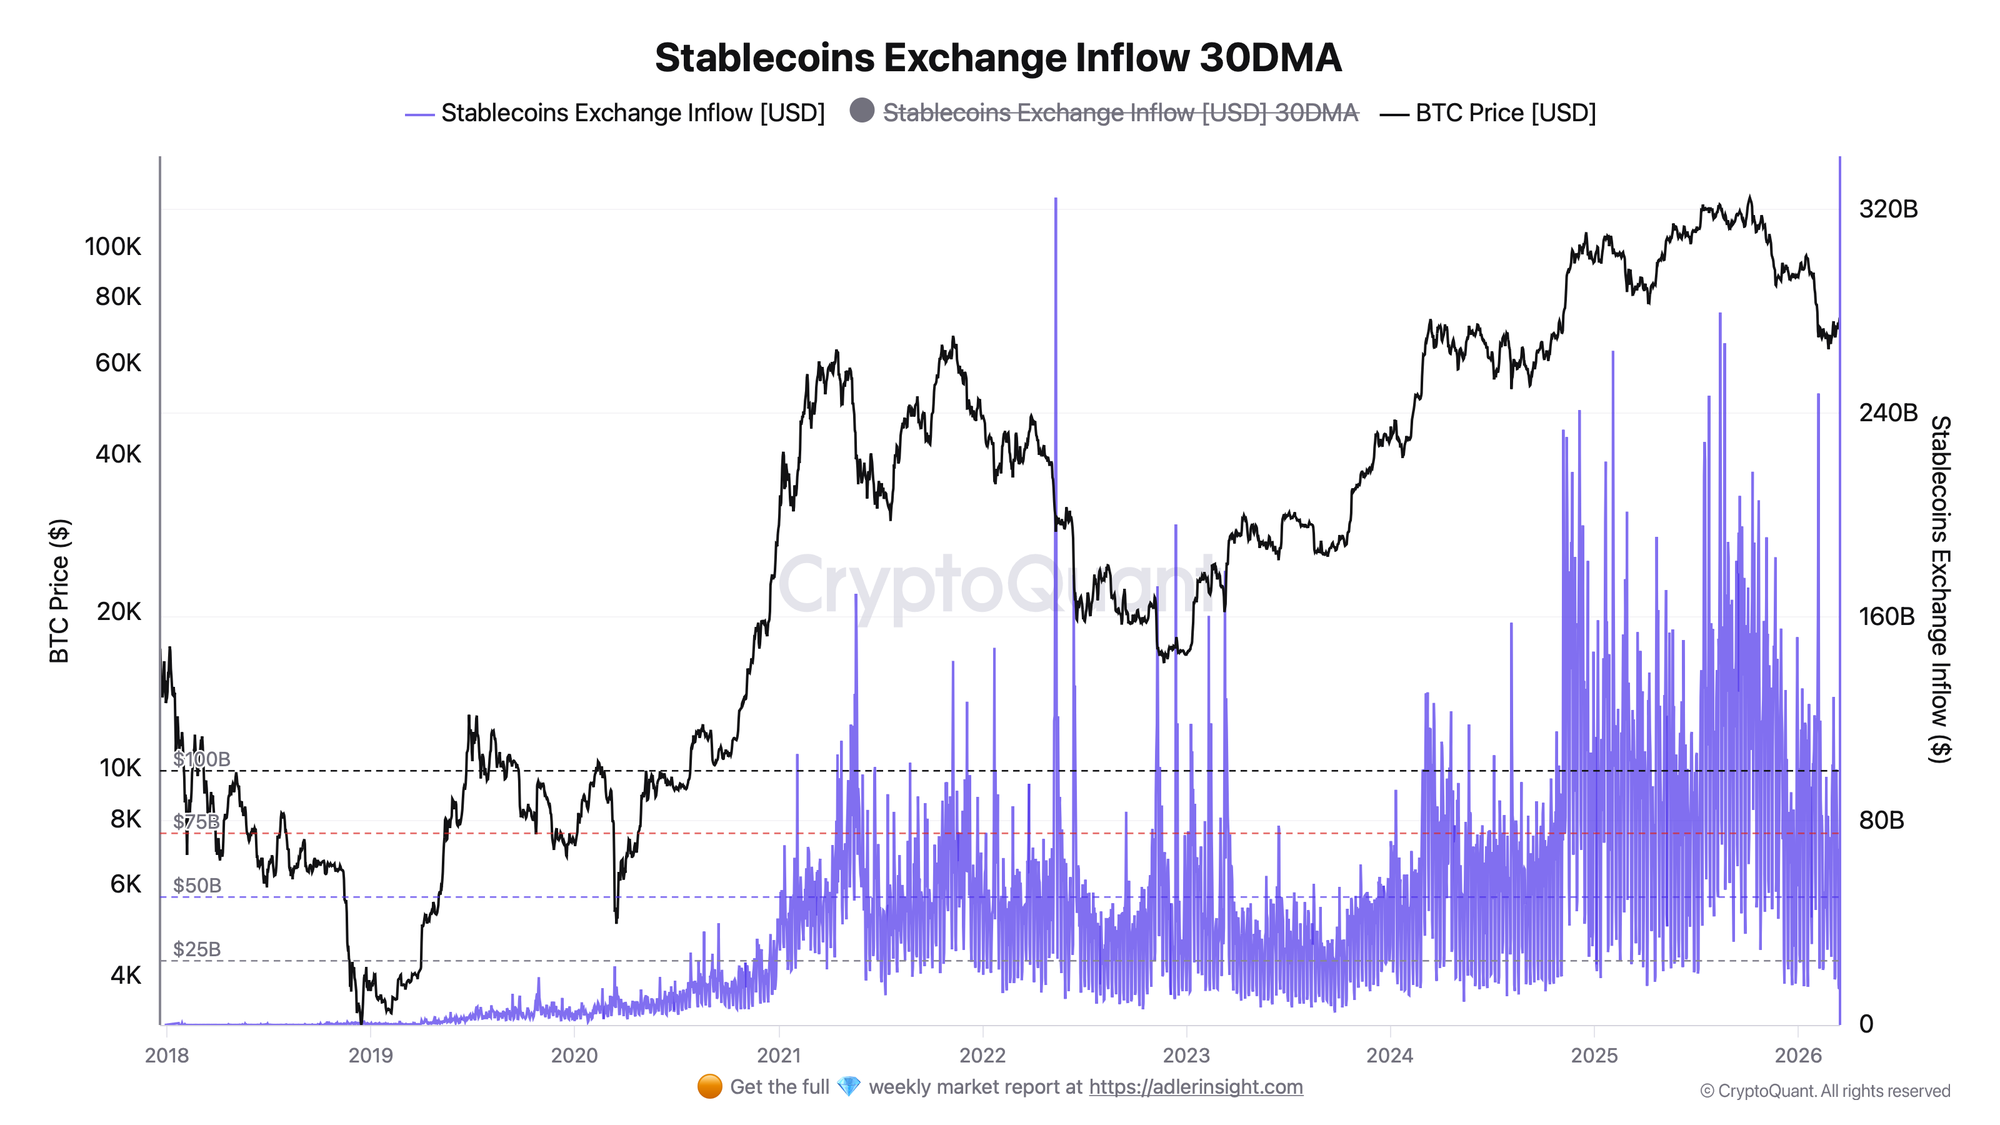
- Key caveat: a single-day spike can reflect internal exchange transfers or derivatives margin top-ups, not genuine retail demand - always read the 30DMA, not the raw daily candle
Signal rule: When the 30DMA crosses above its 90-day average and the BTC exchange reserve is declining simultaneously, the setup signals active deployment of capital into spot Bitcoin.
The Signal Rule
Core formula
Stablecoins Exchange Inflow (daily) = SUM(stablecoin transfers INTO labeled exchange addresses)

30DMA = rolling 30-day average of the daily inflow value
Thresholds (based on 2017-2026 dataset)
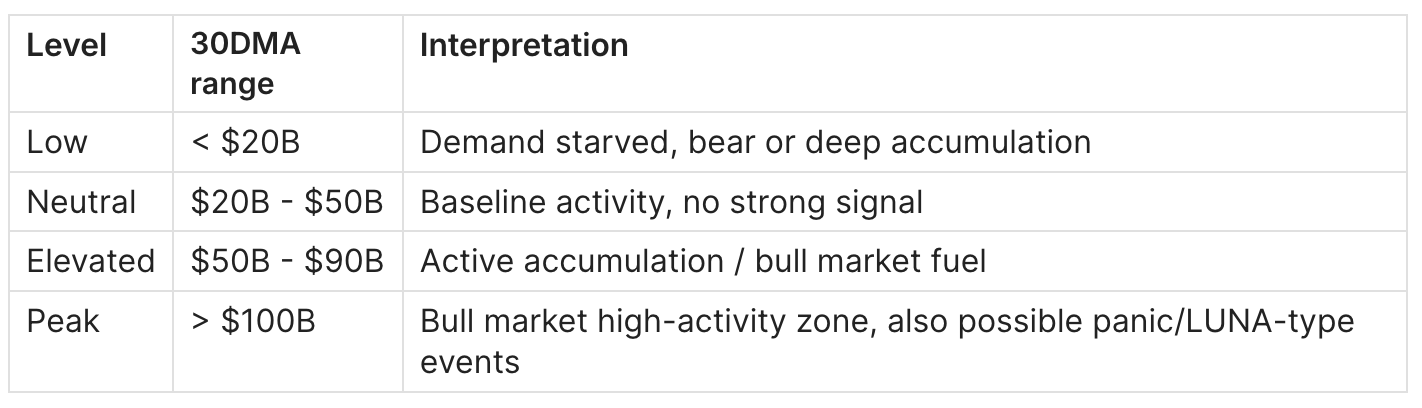
Current reading (March 16, 2026): 30DMA = $60.0B - elevated zone, consistent with mid-bull market conditions. BTC price $73,308.
If X, then Y:
- 30DMA rising from < $40B toward $60B+ with BTC range-bound = accumulation phase, often precedes a leg up
- 30DMA collapsing from > $80B to < $40B while BTC price holds = capital being deployed (bullish if BTC holds) or capital leaving the market entirely (bearish if BTC drops in parallel)
Key Definitions
Stablecoins Exchange Inflow (raw daily): total USD value of USDT, USDC, BUSD, DAI, and other pegged assets transferred into exchange wallets in a 24-hour window. Raw data is noisy due to weekend suppression and occasional internal exchange rebalancing.
30DMA (30-day moving average): rolling average of the last 30 daily observations. The primary lens for reading trend direction. A rising 30DMA means the flow of new capital onto exchanges is structurally increasing.
Exchange Reserve (stablecoins): the cumulative stock of stablecoins held on exchange at any moment - the result of all prior inflows minus outflows. Inflow is the flow; reserve is the tank. Both matter.
Stablecoin Supply Ratio (SSR): ratio of Bitcoin market cap to total stablecoin market cap. Complements inflow data by measuring relative buying power at a macro level.
Dry powder: the colloquial term for stablecoins sitting on exchange ready to be deployed into spot or derivatives purchases.
How to Interpret This Metric
Bullish case
The 30DMA is rising or holding above $50B, BTC exchange reserve is flat or declining (meaning Bitcoin is being withdrawn into self-custody), and stablecoin inflow is accelerating. This combination means: capital is arriving, Bitcoin is leaving exchanges - classic accumulation with demand building. The 2024 Q4 setup matches this description precisely: 30DMA ran from ~$50B in October 2024 to a peak of $142.7B on December 5, 2024, while BTC moved from $60K to $100K+.
Bearish case
The 30DMA is declining from an elevated level (> $80B) while BTC price is also declining. Capital is leaving the system - either rotating to fiat or being withdrawn following losses. The 2022 bear market showed average 30DMA of $46.6B alongside sustained BTC drawdowns. The panic day on May 12, 2022 (LUNA collapse) registered the all-time single-day inflow of $324.7B - a crisis event that front-ran the BTC drop to $17K.
Neutral case
The 30DMA is in the $30B-$50B range with no clear directional trend. Market is consolidating, no strong accumulation or distribution signal.
What matters most
Trend over level. A 30DMA at $60B and rising is more bullish than a 30DMA at $80B and falling. The direction of the 30DMA relative to its own 90-day average is the primary read. Single-day spikes in the raw data almost never mean what they look like - always check the 30DMA.
Historical Examples
Example 1 - Late 2024 Bull Run Setup (October - December 2024)
Period: Oct-Dec 2024
What the indicator showed: 30DMA climbed from ~$50B in early October toward the cycle peak of $142.7B on December 5, 2024. Election-day spike on November 6 produced a single-day inflow of $233.6B (BTC at $74,132), followed by $230.7B on November 12 (BTC at $88,121).
What price did: BTC moved from ~$60K in October to $101K by early December.
Why it worked: the 30DMA acceleration confirmed that capital was genuinely loading onto exchanges to buy the post-election momentum, not just derivatives rebalancing. Rising inflow + falling BTC exchange reserve = textbook bullish divergence.
Example 2 - LUNA Collapse Spike (May 2022)
Period: May 12, 2022
What the indicator showed: single-day inflow of $324.7B - the all-time record in the dataset. 30DMA had been running elevated in the $60-70B range in prior weeks.
What price did: BTC fell from ~$30K to $17K over the following weeks.
Why this was a trap: the spike was panic-driven margin liquidations and forced stablecoin conversions across the LUNA/UST ecosystem, not organic buy demand. The 30DMA subsequently collapsed to below $30B, confirming the bear signal. This is the canonical false-spike warning case.
Example 3 - 2025 Peak Bull Market Activity (July - August 2025)
Period: July-August 2025
What the indicator showed: 30DMA averaged $103.6B across the full year. Individual days: $247.0B on July 25 (BTC $116K), $267.6B on August 22 (BTC $114K), peak single day of $279.7B on August 14 (BTC $120K).
What price did: BTC reached its cycle high near $120K+ during this window.
Context: the 2025 bull market produced the highest sustained 30DMA in history, reflecting a structurally larger stablecoin ecosystem ($250B+ total supply) compared to prior cycles. The absolute threshold for "elevated" moved up compared to 2021.
How to Use It in Practice
Setup
Monitor the 30DMA trend daily. Compare the current 30DMA to its 90-day rolling average. If above - demand structure is expanding. If below - demand structure is contracting.
Trigger
30DMA crosses above the 90-day average after a period of contraction, AND raw daily inflow shows at least three consecutive days above the 30DMA line (confirming the trend is not a single spike).
Confirm
Confirm with two additional signals:
- Stablecoin Exchange Reserve (total): reserve should be rising alongside inflow, confirming capital is accumulating, not just transiting
- Bitcoin Exchange Netflow: Bitcoin Exchange Netflow guide - BTC netflow should be negative (coins leaving exchanges), confirming buyers are deploying the stablecoins into spot
Invalidates when
- Spike is isolated to one day with no 30DMA follow-through
- Rising inflow is accompanied by rising BTC exchange reserve (accumulation is not converting to buy pressure)
- Macro risk-off event (rate hikes, regulatory action) suggests stablecoins are entering as collateral flight, not buy intent
Action
- Bull confirmation: use inflow + reserve + netflow triple confirmation to size into spot positions or scale DCA
- Bear warning: 30DMA falling below 90-day average while BTC price is declining = reduce exposure
- Peak warning: 30DMA has been above $100B for 30+ days and BTC is at new ATH = watch for distribution signals from NUPL and MVRV
Common Pitfalls
1. Reading the raw daily spike as a signal Why it breaks: internal exchange transfers, derivatives rebalancing, and crisis liquidations all produce enormous single-day readings that have nothing to do with new buy demand. Always use the 30DMA. Filter: require 3+ consecutive days above the 30DMA trend line before acting on any directional read.
2. Ignoring the stablecoin reserve - inflow and reserve tell different stories Why it breaks: inflow measures the flow; reserve measures the stock. High inflow with declining reserve means capital is flowing in and being immediately deployed into purchases (bullish). High inflow with rising reserve means capital is loading but not yet deployed (potential future bullish, not current signal). Filter: always check exchange reserve alongside inflow.
3. Comparing absolute levels across cycles without adjusting for ecosystem growth Why it breaks: a 30DMA of $50B in 2021 meant a different share of total stablecoin supply than $50B in 2025 (when total stablecoin supply was $250B+). The absolute number inflates with the ecosystem. Filter: use the 30DMA relative to its own 90-day or 180-day average, not absolute thresholds that were calibrated in earlier cycles.
4. Treating derivatives-exchange inflows the same as spot inflows Why it breaks: stablecoins flowing into derivatives exchanges (Binance futures, Bybit) are used as margin collateral, not to buy spot Bitcoin. A surge in derivatives inflow signals leverage is rising, which can precede volatility in either direction. Filter: where possible, use CryptoQuant's exchange-level breakdown to separate spot vs derivatives exchange inflows.
5. Over-relying on this metric in a ETF-dominated market Why it breaks: since the 2024 spot ETF launch, a significant portion of Bitcoin buy demand bypasses exchanges entirely (via ETF creations settled in cash). Institutional buying through ETFs does not appear in exchange inflow data. Filter: supplement with ETF flow data and stablecoin supply growth (a broader proxy for total crypto demand).
6. Assuming declining 30DMA is always bearish Why it breaks: in the late stages of a bull run, declining inflow can mean stablecoins have already been deployed - i.e., the buying already happened. This is not necessarily bearish for price in the short term, but it removes the forward fuel. Filter: combine with STH SOPR to understand whether existing holders are taking profit, which would confirm the bearish read.
Stablecoins Exchange Inflow vs Stablecoin Exchange Reserve
These two metrics are related but answer different questions.
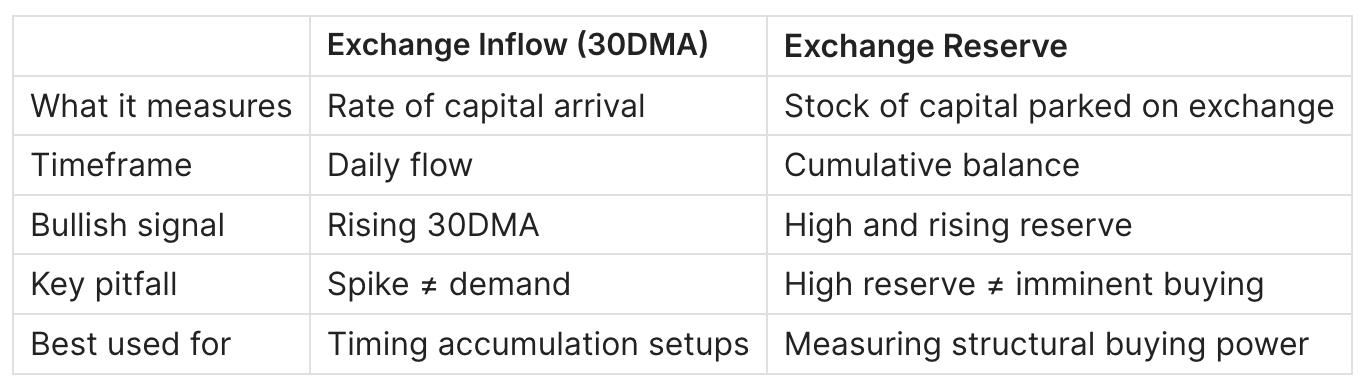
Use inflow to time when demand is building. Use reserve to measure how much buying power has already loaded. The most powerful setup is rising inflow + high reserve + declining BTC exchange reserve simultaneously.
FAQ
What is a significant stablecoins exchange inflow value? In the 2017-2026 dataset, the 30DMA mean is $40.7B and median is $39.7B. A 30DMA above $60B is elevated and consistent with active accumulation or bull market conditions. Absolute thresholds rise over time as the stablecoin ecosystem grows, so always compare the 30DMA to its own trailing average rather than fixed dollar levels.
Where can I find stablecoins exchange inflow data? CryptoQuant is the primary source, under Stablecoin > Exchange Flows > Exchange Inflow Total. Glassnode offers a similar metric for ERC-20 stablecoins (USDT, USDC, DAI, BUSD). The CryptoQuant version covers a broader exchange set and includes derivatives venues.
Does this metric still work after spot Bitcoin ETFs launched in 2024? Partially. ETF demand bypasses on-chain exchange flows, so stablecoin inflow now captures a smaller fraction of total Bitcoin demand than in 2021. However, retail and non-ETF institutional demand still moves through exchanges, so the metric remains useful as a directional signal - just no longer a complete picture of total buy pressure.
What is the difference between stablecoin inflow and stablecoin reserve? Inflow is the daily flow (how much is arriving today). Reserve is the cumulative stock (how much is parked on exchange in total). Rising inflow builds the reserve; high reserve represents waiting buying power.
How do I filter out false spikes in the raw daily data? Use the 30DMA as your primary signal and ignore raw daily readings above 3x the 30DMA unless you can confirm the source (e.g., a known macro event or liquidation cascade). The LUNA collapse day of $324.7B on May 12, 2022 is the canonical example of a crisis spike that was bearish, not bullish.
Is a declining stablecoin inflow always bearish? No. If inflow declines while Bitcoin is rising and exchange reserve is falling, it can mean stablecoins were already deployed and the buying is done - a sign of a late bull market, not immediate reversal. Combine with MVRV Z-Score and NUPL to assess cycle position before interpreting a declining inflow as bearish.
What was the all-time peak 30DMA? $142.7B on December 5, 2024, during the post-US-election Bitcoin rally toward $100K.
How does this metric relate to the Stablecoin Supply Ratio (SSR)? SSR measures the ratio of Bitcoin market cap to total stablecoin market cap - a macro measure of buying power relative to the size of Bitcoin. Inflow measures the active daily deployment of that buying power onto exchanges. Low SSR + rising inflow = the most bullish combination: buying power is large and it is moving into position.
Does stablecoin inflow work on short timeframes (days to weeks)? The raw daily figure is too noisy for day-trading. The 30DMA is most useful on weekly-to-monthly timeframes. For shorter timeframes, use the exchange reserve trend and the raw inflow relative to recent averages as a supplemental signal, not a primary entry trigger.
Related Guides
- Bitcoin Exchange Netflow: What It Is and How to Use It - the paired metric: stablecoin inflow + BTC netflow together form the complete exchange flow picture
- Bitcoin MVRV Ratio: Definition, Formula & Cycle Signals - combine with inflow to identify where in the cycle the demand surge is happening
- Bitcoin NUPL: Net Unrealized Profit/Loss - use alongside inflow to distinguish accumulation from distribution phases
- Bitcoin STH SOPR: What It Is and How to Use It - short-term holder profitability context for interpreting whether inflow is buy-side or panic-sell-side
- Bitcoin LTH vs STH: Supply Dynamics, Cost Basis & Market Structure - understanding who is selling into the stablecoin inflow
- Spot ETFs and Global M2: Thresholds for Overriding the Bitcoin Halving Cycle - critical context for why absolute inflow levels are harder to interpret post-2024
- Bitcoin Supply in Profit: Definition, Thresholds & Market Signals - cross-reference with inflow spikes to assess whether capital is entering at a historically expensive or cheap point
- MVRV Z-Score: How to Identify Bitcoin Market Tops and Bottoms - the macro cycle positioning tool that gives context to any inflow reading
Conclusion
- Stablecoins Exchange Inflow 30DMA is the cleanest on-chain proxy for demand-side momentum - rising means capital is loading, falling means it is leaving or already deployed
- Always read the 30DMA trend relative to its own trailing average, not in absolute terms, because the ecosystem-wide stablecoin supply grows every cycle
- The most powerful signal is the triple confirmation: rising inflow 30DMA + rising stablecoin reserve + declining BTC exchange reserve (all three happening simultaneously)
Next step: pair this metric with Bitcoin Exchange Netflow for the complete exchange flow picture - Bitcoin Exchange Netflow: What It Is and How to Use It