
TL;DR
- What it is: Dormancy Flow = Market Cap ÷ (Average Dormancy × 365) — measures whether Bitcoin is undervalued relative to long-term holder activity
- How it works: Low values mean old coins aren't moving (HODLing); high values mean old coins are actively spent (distribution)
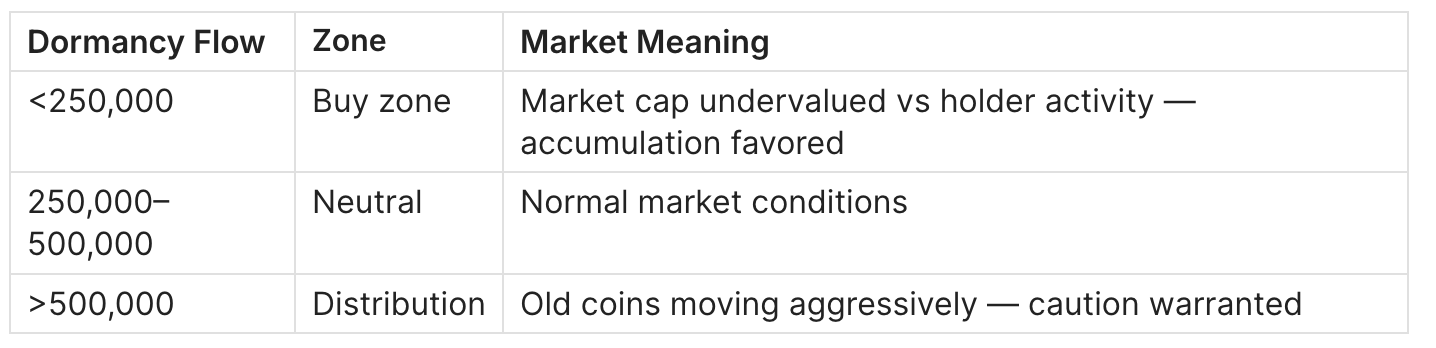
- The buy zone: Dormancy Flow <250,000 has historically marked every major cycle bottom since 2012
- Key insight: This metric catches bottoms, not tops — use it for accumulation timing, not exit signals
- Caution: Single readings can be noisy; use 7-day averages and confirm with MVRV <1.0 or NUPL <0
Signal rule: When Dormancy Flow drops below 250,000 while MVRV is below 1.0, historically it has been an optimal accumulation window.
The Signal Rule
Dormancy Flow identifies when Bitcoin's market cap is "cheap" relative to the spending behavior of long-term holders.
Formula:
Dormancy Flow = Market Cap (USD) ÷ (Annualized Dormancy Value)

Where:
Annualized Dormancy Value = Average Dormancy × 365 × Price
Average Dormancy = CDD ÷ Transaction Volume (in BTC)
Threshold interpretation:
How to read it:
- Bullish: Dormancy Flow <250K means long-term holders are NOT selling, even as price drops. This reflects conviction and supply scarcity.
- Bearish: Dormancy Flow >500K means veteran holders are spending old coins rapidly. Historically seen near cycle tops.
Example: In January 2022, Dormancy Flow dropped to ~244,000 — the sixth time in Bitcoin's history it entered the buy zone. Price was ~$42K. Within 24 months, price exceeded $100K.
Key Definitions
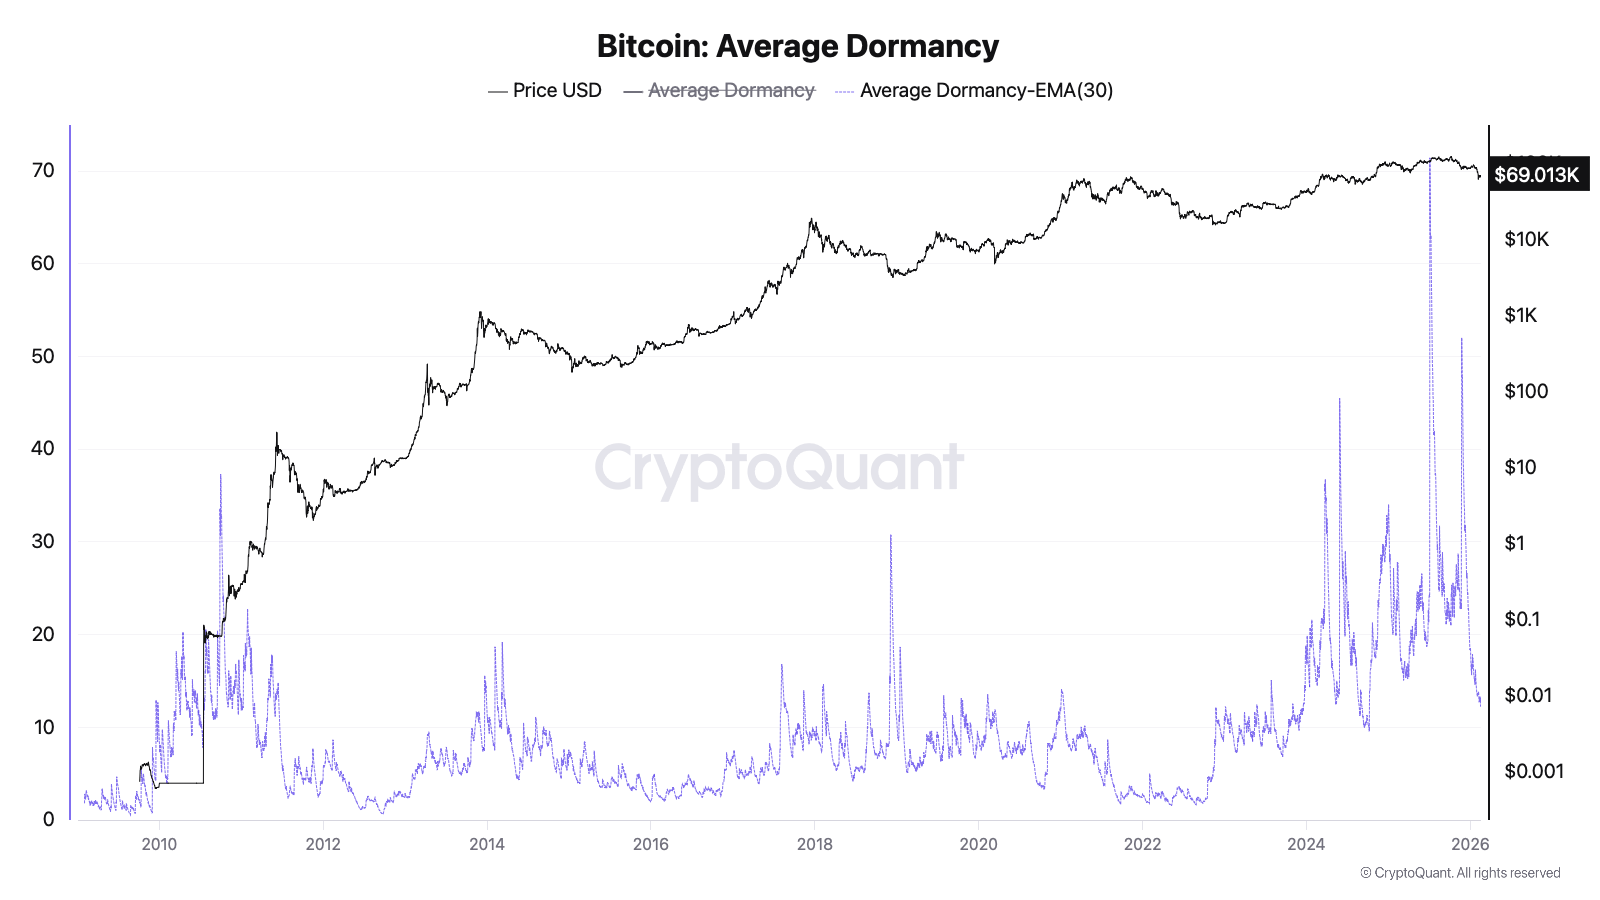
Average Dormancy The average number of days each transacted Bitcoin remained dormant before moving. Calculated as CDD ÷ Daily Transaction Volume. High dormancy = old coins moving; low dormancy = young coins moving.
Coin Days Destroyed (CDD) The sum of (BTC amount × days held) for all spent outputs in a period. Foundation metric for Dormancy. Full CDD guide →
Annualized Dormancy Value Dormancy multiplied by 365 days and current price. Represents the USD "weight" of holder behavior over a year-equivalent period.
Entity-Adjusted Dormancy Flow A refined version that clusters addresses by entity (exchange, whale, etc.) to reduce noise from internal transfers. Available on Glassnode.
How to Interpret Dormancy Flow
Bullish Case (Dormancy Flow <250K)
When Dormancy Flow drops below 250,000:
- Long-term holders are NOT spending their old coins
- Supply from veteran participants is scarce
- Market cap is "cheap" relative to network conviction
- Historically: 100% of readings <250K preceded major rallies within 6–18 months
What you typically see: Price in downtrend or consolidation. Sentiment bearish. On-chain accumulation by whales. Exchange reserves declining.
Bearish Case (Dormancy Flow >500K)
When Dormancy Flow exceeds 500,000:
- Old coins are flooding back into circulation
- Long-term holders are distributing aggressively
- Spending velocity outpacing market cap growth
- Often coincides with late-stage bull market euphoria
What you typically see: Price at or near all-time highs. Retail FOMO. Exchange inflows rising. Social media mania.
Neutral Zone (250K–500K)
Normal market conditions. Dormancy Flow provides no directional signal. Defer to other metrics:
- MVRV Ratio for valuation
- Exchange Netflow for demand/supply pressure
- NUPL for sentiment
What Matters Most
Trend > single reading. A one-day spike or dip can be noise. Use 7-day or 30-day averages.
Extreme lows are the signal. Dormancy Flow is asymmetric — it's most useful at bottoms (<250K), less reliable for calling exact tops.
Combine with valuation. Dormancy Flow + MVRV <1.0 + NUPL <0 = high-conviction accumulation setup.
Historical Examples
Example 1: January 2022 — Buy Signal Before 2023-2024 Rally
Date: January 12, 2022
What the indicator showed: Dormancy Flow dropped to ~244,000 — entering the buy zone for the sixth time in Bitcoin's history. Average Dormancy (30-day EMA) was declining, indicating old coins were staying put.
What happened next: Bitcoin was trading at ~$42,000. Over the following 24 months, despite further drawdown to $15,500 (November 2022), the asset recovered to new all-time highs above $100,000 by late 2024.
Why it worked: The signal correctly identified that long-term holders were not capitulating despite the price crash. Supply remained locked. When demand returned (ETF approvals), scarcity drove explosive price appreciation.
Key lesson: Dormancy Flow <250K doesn't mean "bottom is in today" — it means "accumulation window is open." The actual bottom came 10 months later, but the signal zone was valid throughout.
Example 2: November 2022 — FTX Crash Capitulation
Date: November 9-21, 2022
What the indicator showed: Average Dormancy collapsed from ~5.2 to ~4.1 days during the FTX implosion. This counterintuitive reading meant that despite chaos, OLD coins were NOT moving — only young, recently-acquired coins were being panic-sold.
What happened next: Bitcoin bottomed at $15,476 on November 21, 2022. Dormancy Flow remained deep in the buy zone throughout. Within 14 months, price exceeded $45,000.
Why it worked: The FTX collapse was a "weak hands" capitulation event. Long-term holders (evidenced by low dormancy) held firm. The metric correctly signaled that structural selling pressure was limited.
Key lesson: During black swan events, watch dormancy direction. If old coins stay dormant while price crashes, it's a capitulation bottom. If old coins start moving, further downside may follow.
Example 3: December 2018 — Classic Cycle Bottom
Date: December 15, 2018
What the indicator showed: Dormancy Flow dropped below 200,000. Average Dormancy (30-day EMA) was elevated at ~20+ days — but critically, this was DECLINING from even higher levels, indicating the distribution phase was ending.
What happened next: Bitcoin bottomed at $3,122. Over the next 36 months, price reached $69,000 (November 2021).
Why it worked: The December 2018 bottom showed classic accumulation behavior: Dormancy Flow in buy zone, declining average dormancy (less old coin movement), and extreme bearish sentiment. All three aligned.
Key lesson: The best Dormancy Flow signals come when the metric enters the buy zone AND average dormancy starts falling (old coins going quiet).
How to Use It in Practice
Setup
Monitor Dormancy Flow on a weekly basis during bear markets or significant corrections. The metric moves slowly — daily monitoring during bull markets adds little value.
Data sources:
- Glassnode (Entity-Adjusted Dormancy Flow)
- CryptoQuant (Average Dormancy)
- Bitcoin Magazine Pro (Dormancy Flow chart)
Trigger
Primary signal: Dormancy Flow drops below 250,000
Confirm
Before acting on Dormancy Flow, confirm with:
- MVRV < 1.0 — Market trading below realized value (MVRV Guide)
- NUPL < 0 — Network in aggregate unrealized loss (NUPL Guide)
- Exchange Netflow negative — Coins leaving exchanges (Exchange Netflow Guide)
High-conviction setup: All three confirmations + Dormancy Flow <250K = historically optimal accumulation window.
Invalidates When
- Dormancy Flow rises above 350,000 while price continues falling (old coins capitulating — bearish)
- MVRV stays >2.0 despite Dormancy Flow reading (conflicting signals)
- Average Dormancy spikes sharply higher (old coins suddenly moving)
Action
Dormancy Flow signals favor DCA accumulation, not lump-sum timing.
- Enter the buy zone = begin or increase DCA
- Remain in buy zone = continue accumulating
- Exit buy zone (>250K) + MVRV >1.5 = pause accumulation, reassess
Not financial advice. This is a risk filter framework, not a trading system.
Common Pitfalls
1. Expecting Immediate Bottoms
The mistake: Seeing Dormancy Flow <250K and expecting price to reverse within days.
Why it fails: The buy zone can persist for months (see January–November 2022). The signal identifies a favorable accumulation WINDOW, not a precise bottom.
How to filter: Use DCA strategy across the entire buy zone period rather than attempting to time the exact low.
2. Ignoring Entity Adjustment
The mistake: Using raw Dormancy Flow without accounting for exchange internal transfers or custodian movements.
Why it fails: Large exchanges moving coins internally can spike dormancy metrics without any real market significance.
How to filter: Use Entity-Adjusted Dormancy Flow (Glassnode) when possible. Cross-reference with exchange netflow data.
3. Using It for Tops
The mistake: Trying to time cycle tops with Dormancy Flow >500K.
Why it fails: The metric is asymmetric. While low values reliably indicate bottoms, high values are noisier and often persist throughout entire bull markets.
How to filter: For top detection, use MVRV Z-Score or NUPL >0.75 instead.
4. Confusing Dormancy with Dormancy Flow
The mistake: Treating "Average Dormancy" and "Dormancy Flow" as the same metric.
Why it fails: Average Dormancy is measured in DAYS. Dormancy Flow is measured in USD. They move differently and have different thresholds.
How to filter: Always check units. Dormancy Flow uses the ~250K threshold; Average Dormancy uses ~15-25 days as baseline.
5. Single-Day Readings
The mistake: Reacting to a one-day Dormancy Flow spike or dip.
Why it fails: Whale movements or exchange operations can distort single days.
How to filter: Use 7-day or 30-day moving averages for actionable signals.
Dormancy Flow vs Related Metrics
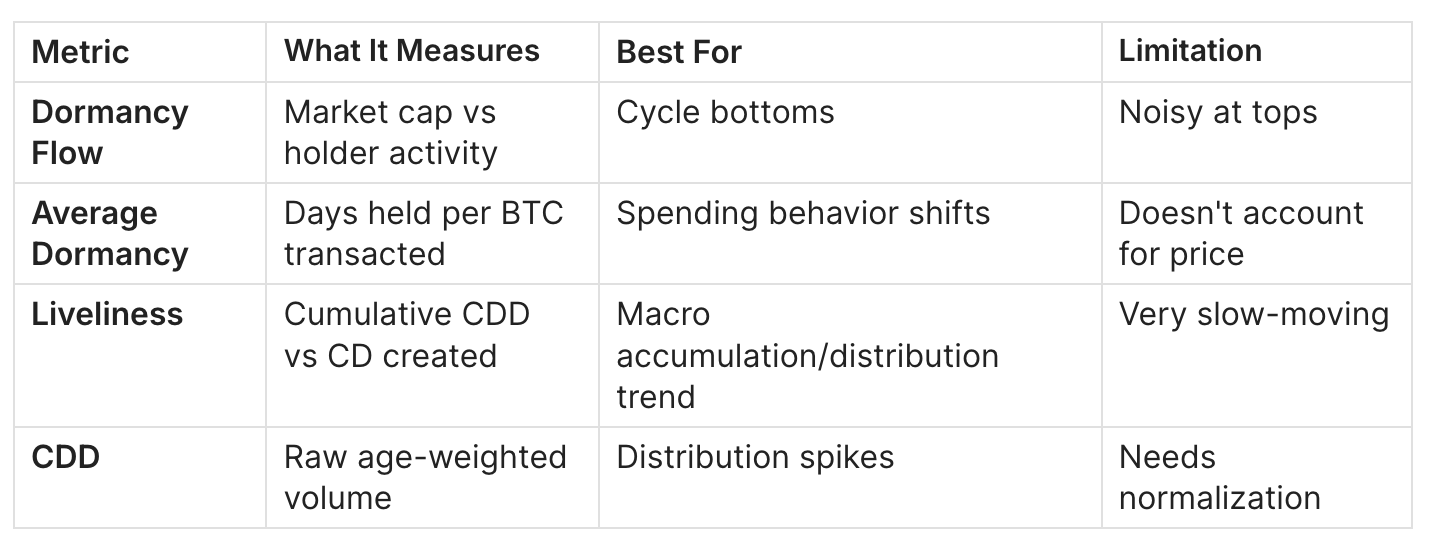
When to use Dormancy Flow: Specifically for bottom detection and accumulation timing. It incorporates market cap, making it price-aware unlike raw CDD.
When to use CDD/Liveliness: For understanding distribution patterns and macro trends without price context. Full guide →
FAQ
What is a significant Dormancy Flow value?
Below 250,000 is the historically significant buy zone. Only ~5% of Bitcoin's history has traded with Dormancy Flow this low. Every instance preceded a major rally within 6–18 months.
Where can I find Dormancy Flow data?
Glassnode offers Entity-Adjusted Dormancy Flow (paid tier). Bitcoin Magazine Pro provides a free Dormancy Flow chart. CryptoQuant offers Average Dormancy which you can use to calculate the metric manually.
Does Dormancy Flow still work after ETFs?
The January 2024 ETF approval created a structural demand shift, but Dormancy Flow signals remained valid. The key change: accumulation windows may be shorter as institutional demand absorbs supply faster.
How is Dormancy Flow different from MVRV?
MVRV compares market price to average cost basis (realized price). Dormancy Flow compares market cap to holder behavior (spending velocity). They measure different things but often confirm each other at extremes.
Can I use Dormancy Flow for altcoins?
Only for UTXO-based coins (Litecoin, Bitcoin Cash). Most altcoin providers don't track this metric. For account-based chains like Ethereum, dormancy concepts require different calculations.
What's the difference between raw and entity-adjusted?
Entity-adjusted clusters addresses belonging to the same entity (exchanges, custodians) to filter out internal transfers. Raw dormancy includes all transactions. Entity-adjusted is more accurate but requires paid data access.
Why did Dormancy Flow stay low throughout 2022?
Because long-term holders were NOT selling despite the price crash. This was the signal: weak hands capitulated, strong hands held. Low dormancy flow correctly indicated accumulation opportunity.
Should I use Dormancy Flow for short-term trading?
No. Dormancy Flow moves slowly and is designed for macro cycle positioning. For short-term signals, use Open Interest patterns or STH SOPR.
Related Guides
Parent pillar:
Confirmation metrics:
- Bitcoin MVRV Ratio: Definition, Formula & Cycle Signals
- Bitcoin NUPL (Net Unrealized Profit/Loss) Explained
- Bitcoin Exchange Netflow: What It Is and How to Use It
Related cycles analysis:
- MVRV Z-Score: How to Identify Bitcoin Market Tops and Bottoms
- Bitcoin Supply in Profit: Definition, Thresholds & Market Signals
- Bitcoin LTH vs STH: Supply Dynamics, Cost Basis & Market Structure
Conclusion
- Dormancy Flow <250K has marked every major Bitcoin bottom — this is its primary use case
- The signal identifies accumulation windows, not exact bottoms — use DCA, not lump-sum timing
- Always confirm with MVRV and NUPL — Dormancy Flow alone is necessary but not sufficient
- Avoid using it for tops — the metric is asymmetric; use MVRV Z-Score or NUPL for distribution signals
Next step: Understand the foundation metric → CDD & Liveliness Guide
Weekly Engine: One action per week (BUY / HOLD / EXIT). Triggers that change it. Invalidation that protects you. 10 minutes/week. No noise. Just the plan. → adlerinsght.com
Adler AM: Free daily morning briefs in your inbox → axeladlerjr.com