
TL;DR
- What it is: VDD Multiple = (30-day VDD ÷ 365-day VDD) × Terminal Adjustment — measures short-term spending velocity against yearly baseline
- How it works: High values mean old coins are being spent faster than normal; low values mean HODLing dominates
- The danger zone: VDD Multiple >2.9 = top 5% of Bitcoin's history — every major cycle top occurred here
- Key insight: This metric catches tops, not bottoms — use it for risk management, not accumulation timing
- Caution: VDD can stay elevated for weeks; use for scaling out, not precise timing
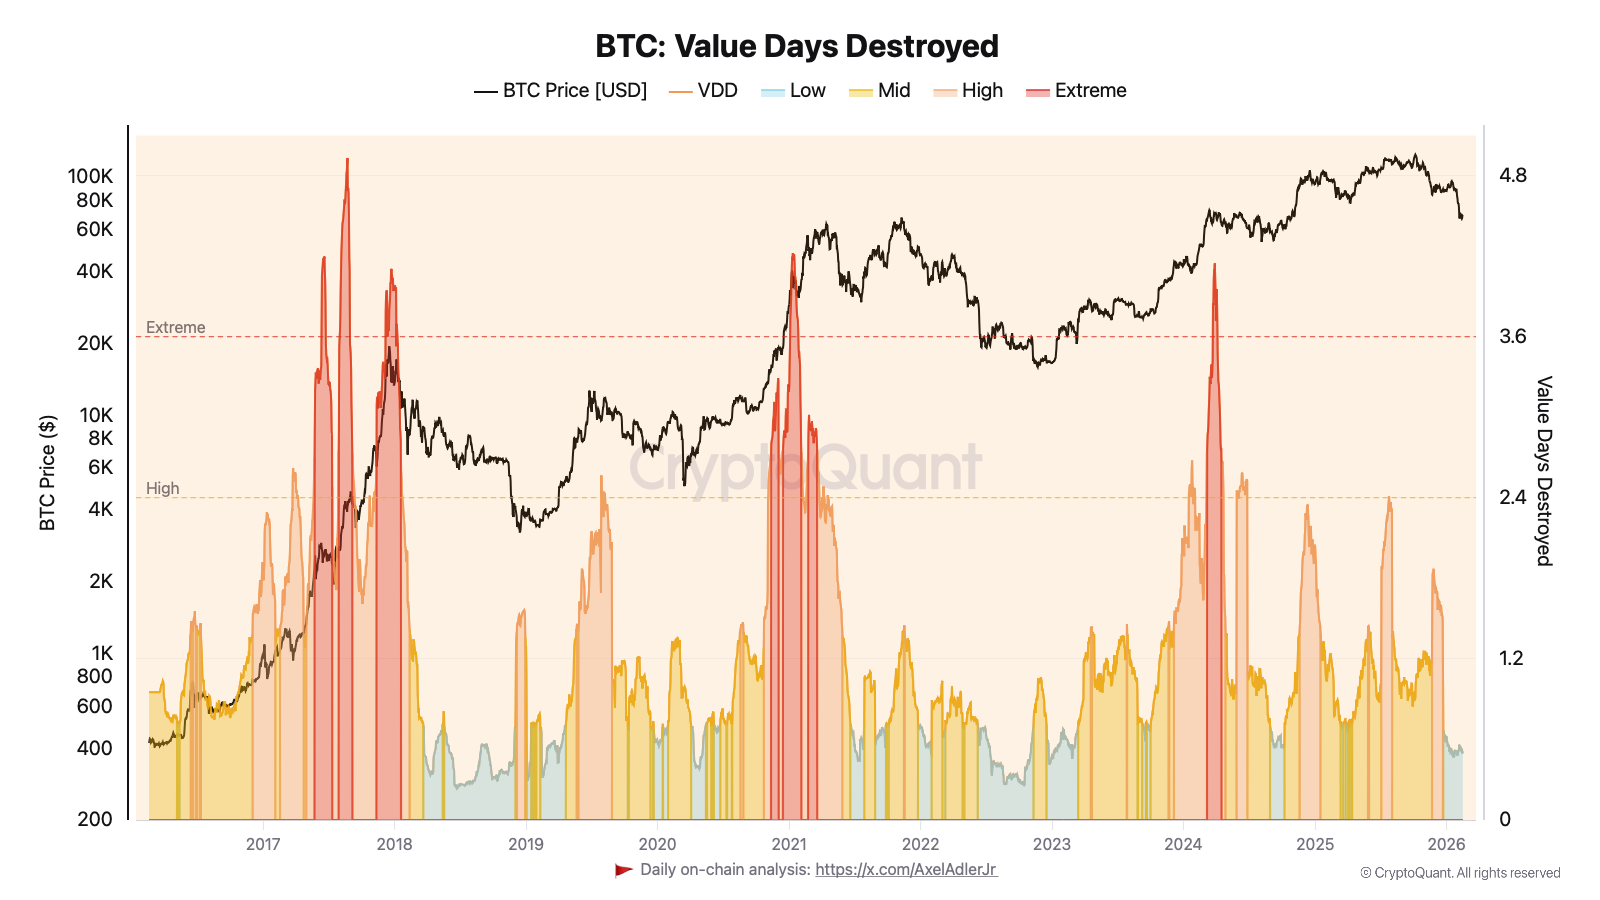
Signal rule: When VDD Multiple exceeds 2.9 while price makes new highs, historically this has marked the final phase of bull markets. Only 5% of Bitcoin's history traded above this level.
The Signal Rule
VDD Multiple identifies when Bitcoin is "overheating" by comparing near-term spending activity to the yearly average.
Formula:
VDD Multiple = (SMA_30_VDD ÷ SMA_365_VDD) × (Circulating Supply ÷ 21,000,000)

Where:
VDD (Value Days Destroyed) = CDD × BTC Price
SMA_30_VDD = 30-day simple moving average of VDD
SMA_365_VDD = 365-day simple moving average of VDD
Terminal Adjustment = Current Supply ÷ 21M (normalizes for supply growth)
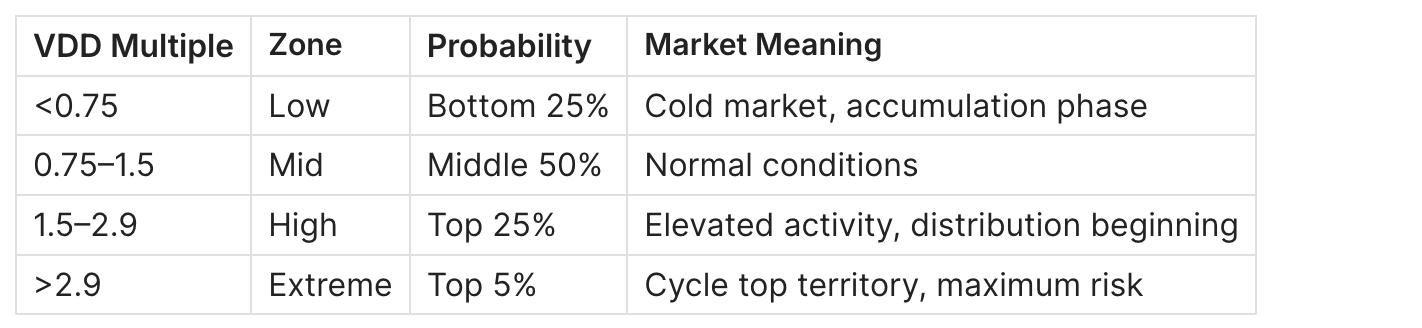
Probability zones:
How to read it:
- Bullish (Low zone): VDD <0.75 means spending velocity is well below average. Long-term holders are sitting still. Historically seen during bear markets and early recovery — accumulation favored.
- Bearish (Extreme zone): VDD >2.9 means short-term destruction is ~3× the yearly average. Old coins flooding the market. Every major cycle top in Bitcoin's history printed VDD >2.9.
Example: In December 2017, VDD Multiple hit 4.0 as Bitcoin reached $20K. Price crashed 84% over the following year. The signal was accurate within days of the exact top.
Key Definitions
Value Days Destroyed (VDD) CDD multiplied by BTC price at the time of transaction. This adds USD-weighting to destruction, allowing comparison across different price environments. A 100-day-old coin moved at $50K destroys more "value days" than the same coin moved at $5K.
Coin Days Destroyed (CDD) The foundation metric. Sum of (BTC amount × days held) for all spent outputs. Full CDD guide →
Terminal Adjustment Multiplying by (Supply ÷ 21M) normalizes the metric for supply growth over time. Without this, early Bitcoin history would appear artificially volatile.
30/365 Ratio Comparing 30-day vs 365-day averages creates an oscillator that shows deviation from "normal." When 30-day activity far exceeds the yearly average, the market is in a distribution phase.
How to Interpret VDD Multiple
Bullish Case (VDD <0.75 — Low Zone)
When VDD Multiple drops below 0.75:
- Spending velocity is 25%+ below the yearly average
- Long-term holders are not distributing
- Market has "cooled off" — supply pressure is minimal
- Historically: Occurs during bear market bottoms and early bull phase
What you typically see: Price consolidation or slow recovery. Low volatility. Declining exchange reserves. Negative sentiment.
Current reading (Feb 2026): VDD = 0.50 — firmly in the Low zone, suggesting the market is in accumulation mode despite recent volatility.
Bearish Case (VDD >2.9 — Extreme Zone)
When VDD Multiple exceeds 2.9:
- Short-term destruction is nearly 3× the yearly average
- Old coins are aggressively re-entering circulation
- Late-stage distribution is underway
- Historically: Only 5% of all trading days have seen VDD >2.9 — and they cluster around cycle tops
What you typically see: Price at or near all-time highs. Mainstream media coverage. Retail FOMO. Exchange inflows spiking. Social media euphoria.
Neutral Zone (VDD 0.75–2.9)
Most of Bitcoin's trading history falls here. VDD Multiple provides no strong directional signal. Use complementary metrics:
- MVRV Z-Score for valuation extremes
- NUPL for sentiment
- Exchange Netflow for supply/demand pressure
What Matters Most
Sustained readings > one-day spikes. A single day above 2.9 is notable but not conclusive. Cluster of days in the Extreme zone = high-conviction top signal.
Context matters. VDD >2.9 at all-time highs = cycle top. VDD >2.9 during a crash = capitulation event (different implication).
Asymmetric utility. VDD is most reliable for TOPS (Extreme zone) and least useful for exact bottoms. For bottom detection, use Dormancy Flow.
Historical Examples
Example 1: December 2017 — The $20K Cycle Top
Date: December 1–20, 2017
What the indicator showed: VDD Multiple stayed in the Extreme zone (>2.9) for the entire month of December, peaking at 4.0 on December 20th. This was the highest sustained reading in Bitcoin's history at that time.
Price at signal: $17,000–$19,500
What happened next: Bitcoin topped at $19,783 on December 17, then crashed to $3,122 over the following 12 months — an 84% drawdown.
Why it worked: The VDD signal correctly identified that long-term holders were distributing at an unprecedented rate. The 30-day spending velocity was 4× the yearly average — a clear sign of exhaustion.
Key data points:
- Dec 7: VDD = 3.78
- Dec 17 (ATH): VDD = 3.80
- Dec 20: VDD = 4.00 (peak)
Example 2: April–November 2021 — Double Top Structure
Date: April 2021 and November 2021
What the indicator showed: Unlike 2017, the 2021 cycle produced VDD readings in the High zone (2.2–2.5) but NOT the Extreme zone (>2.9). The VDD Multiple peaked around 2.4 during both the April top ($64K) and November top ($69K).
Price at signal: $50K–$69K
What happened next: The first peak in April led to a 55% correction. The second peak in November led to a 77% bear market decline.
Why it partially worked: VDD correctly signaled elevated distribution (High zone), but the lack of Extreme readings made the exact timing less clear than 2017. The 2021 cycle showed diminishing intensity compared to previous cycles.
Key lesson: VDD >2.9 is a high-conviction signal. VDD in the 2.0–2.9 range requires additional confirmation from MVRV and NUPL.
Example 3: January 2024 — ETF Approval Distribution
Date: January 16–25, 2024
What the indicator showed: VDD Multiple spiked from ~2.0 to 2.67 following the spot ETF approval on January 10. This was the highest reading since November 2021.
Price at signal: $39K–$45K
What happened next: Price corrected briefly to $38K, then resumed rallying to new all-time highs above $100K by late 2024.
Why it didn't mark a cycle top: The ETF approval created unique dynamics — long-term holders distributed into unprecedented institutional demand. VDD signaled distribution, but structural demand absorbed the supply.
Key lesson: VDD must be interpreted alongside demand-side metrics. High VDD + rising exchange reserves = bearish. High VDD + ETF inflows = supply being absorbed.
How to Use VDD Multiple in Practice
Setup
Monitor VDD Multiple weekly during bull markets. The metric becomes critical when price approaches previous all-time highs.
Data sources:
- CryptoQuant (custom query or community charts)
- Glassnode (VDD and spending velocity metrics)
- Bitcoin Magazine Pro (VDD Multiple chart)
Trigger
Primary signal: VDD Multiple enters the Extreme zone (>2.9)
Confirm
Before acting on VDD signal, confirm with:
- MVRV Z-Score >7 — Extreme overvaluation (MVRV Z-Score Guide)
- NUPL >0.75 — Euphoria/greed territory (NUPL Guide)
- Exchange inflows rising — Distribution to exchanges (Exchange Netflow Guide)
High-conviction top signal: VDD >2.9 + MVRV Z-Score >7 + NUPL >0.75 = historically marks final stage of bull markets.
Invalidates When
- VDD drops back below 2.0 while price holds highs (distribution absorbed)
- ETF/institutional inflows remain strong (demand offsetting supply)
- Exchange reserves declining despite high VDD (buyers absorbing)
Action
VDD signals favor scaling out, not binary exits.
Scaling framework:
- VDD enters High zone (1.5–2.9): Begin reducing exposure (10–20%)
- VDD exceeds 2.9: Accelerate reduction (additional 20–30%)
- VDD >3.5 sustained: Maximum risk — consider significant de-risking
Not financial advice. This is a risk filter framework, not a trading system.
Common Pitfalls
1. Expecting Immediate Tops
The mistake: Seeing VDD >2.9 and expecting price to crash within days.
Why it fails: VDD can stay elevated for weeks or months. December 2017 saw VDD >3.0 for nearly the entire month before the final top.
How to filter: Use VDD for SCALING decisions, not precise timing. Begin reducing exposure when VDD enters Extreme zone; don't try to pick the exact top.
2. Ignoring Demand Context
The mistake: Treating high VDD as automatically bearish without considering demand.
Why it fails: The 2024 ETF approval showed that high distribution can be absorbed by new demand sources. VDD alone doesn't account for buyer-side dynamics.
How to filter: Combine VDD with exchange netflow. High VDD + net outflows = demand absorbing supply. High VDD + net inflows = genuine distribution pressure.
3. Using VDD for Bottoms
The mistake: Trying to accumulate based on low VDD readings.
Why it fails: VDD is asymmetric. The Extreme zone (>2.9) reliably signals tops, but the Low zone (<0.75) can persist for years during bear markets. It's a poor timing tool for entries.
How to filter: For bottom detection, use Dormancy Flow or MVRV <1.0.
4. Confusing VDD with CDD
The mistake: Treating Value Days Destroyed and Coin Days Destroyed as equivalent.
Why it fails: CDD is measured in coin-days. VDD is measured in USD-weighted coin-days. A 10M CDD reading at $10K is very different from 10M CDD at $100K.
How to filter: Always check which metric you're viewing. VDD Multiple uses the USD-weighted version specifically to allow cross-cycle comparison.
5. Single-Day Spikes
The mistake: Overreacting to a one-day VDD spike into the Extreme zone.
Why it fails: Single-day spikes can result from large entity movements (exchange cold wallet rotations, ETF rebalancing) that don't reflect broad distribution.
How to filter: Look for sustained readings over 5–10 days. A cluster of Extreme-zone days is far more significant than a single spike.
VDD Multiple vs Related Metrics
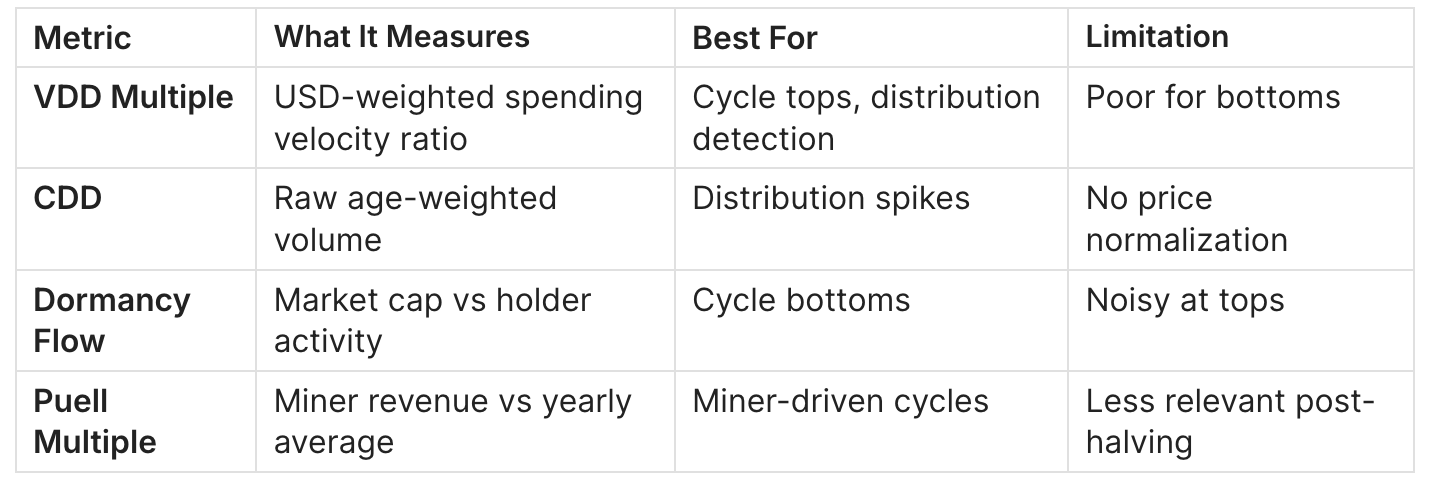
When to use VDD Multiple: Specifically for top detection and risk management during bull markets. Its USD-weighting makes it comparable across different price environments.
When to use CDD: For understanding raw destruction patterns without price context. Full CDD guide →
SQL Query Reference
For those running custom analysis on CryptoQuant BigQuery
-- VDD Multiple calculation (simplified)
WITH vdd_data AS (
  SELECT
    date,
    price * cdd AS vdd,
    AVG(price * cdd) OVER (ORDER BY date ROWS 29 PRECEDING) AS sma_30,
    AVG(price * cdd) OVER (ORDER BY date ROWS 364 PRECEDING) AS sma_365
  FROM btc_metrics
)
SELECT
  date,
  (sma_30 / sma_365) * (current_supply / 21000000) AS vdd_multiple,
  CASE
    WHEN (sma_30 / sma_365) < 0.75 THEN 'Low'
    WHEN (sma_30 / sma_365) < 1.5 THEN 'Mid'
    WHEN (sma_30 / sma_365) < 2.9 THEN 'High'
    ELSE 'Extreme'
  END AS zone
FROM vdd_data
Notes:
- The 30/365 ratio creates the oscillator effect
- Terminal adjustment (supply/21M) normalizes across time
- Zone thresholds derived from probability distribution analysis
FAQ
What is a significant VDD Multiple value?
Above 2.9 is the critical threshold. Only 5% of Bitcoin's trading history has seen VDD this high, and every major cycle top occurred in this zone.
Where can I find VDD Multiple data?
Bitcoin Magazine Pro offers a free VDD Multiple chart. CryptoQuant provides the underlying data for custom queries. Glassnode tracks related spending velocity metrics.
Does VDD Multiple still work after ETFs?
The 2024 ETF cycle showed VDD remains useful but must be combined with demand-side analysis. High VDD + strong ETF inflows = supply being absorbed, not a top signal.
How is VDD different from the Puell Multiple?
Puell Multiple compares miner revenue to its yearly average — focused on supply-side (miner) behavior. VDD Multiple compares all spending activity to its yearly average — focused on all holder behavior.
What's the highest VDD reading ever?
The 2017 cycle saw VDD reach approximately 4.2 during peak euphoria. The 2021 cycle peaked around 2.5, suggesting diminishing cycle intensity.
Can I use VDD for altcoins?
Only for UTXO-based chains (Litecoin, Bitcoin Cash) where CDD can be calculated. Most altcoin data providers don't track this metric.
Why does VDD use terminal adjustment?
Without the (Supply/21M) factor, early Bitcoin data would appear artificially extreme due to smaller supply. Terminal adjustment creates comparable readings across different eras.
What if VDD stays high but price keeps rising?
This occurred during 2024. High VDD with continued upside usually means strong demand is absorbing distribution. Watch exchange reserves and ETF flows for confirmation.
Related Guides
Parent pillar:
Complementary cluster (bottom detection):
Confirmation metrics:
- MVRV Z-Score: How to Identify Bitcoin Market Tops and Bottoms
- Bitcoin NUPL (Net Unrealized Profit/Loss) Explained
- Bitcoin Exchange Netflow: What It Is and How to Use It
Related analysis:
- Bitcoin Puell Multiple: Definition, Formula & Miner Signals
- Bitcoin LTH vs STH: Supply Dynamics, Cost Basis & Market Structure
Conclusion
- VDD Multiple >2.9 has marked every major Bitcoin cycle top — this is its primary use case
- The signal works for scaling out, not precise timing — distribution phases can last weeks
- Always combine with demand-side metrics — high VDD + strong demand = supply being absorbed
- Current reading (Feb 2026): VDD = 0.50 — firmly in accumulation zone, no distribution signal
Next step: Understand bottom detection → Dormancy Flow Guide
Weekly Engine: One action per week (BUY / HOLD / EXIT). Triggers that change it. Invalidation that protects you. 10 minutes/week. No noise. Just the plan. → adlerinsght.com
Adler AM: Free daily morning briefs in your inbox → axeladlerjr.com