
🎧 Morning Brief #122- audio debate on today’s market setup
Bitcoin short-term holders have remained in unrealized loss territory for several months. Two charts show the realized price structure across cohorts - from STH (under 155 days) to LTH (over 155 days) - and reveal where the main potential supply overhang is concentrated today.
TL;DR
BTC price ($68K) is trading approximately 24% below the aggregate realized price of short-term holders ($88.9K), while the LTH cohort retains a notable buffer of unrealized profit at a realized price of around $52.9K. This points to a structural asymmetry: the primary pressure is coming from STH, while long-term holders do not yet appear to be a source of mass distribution.
BTC Realized Price by STH Cohorts (0d-6m)
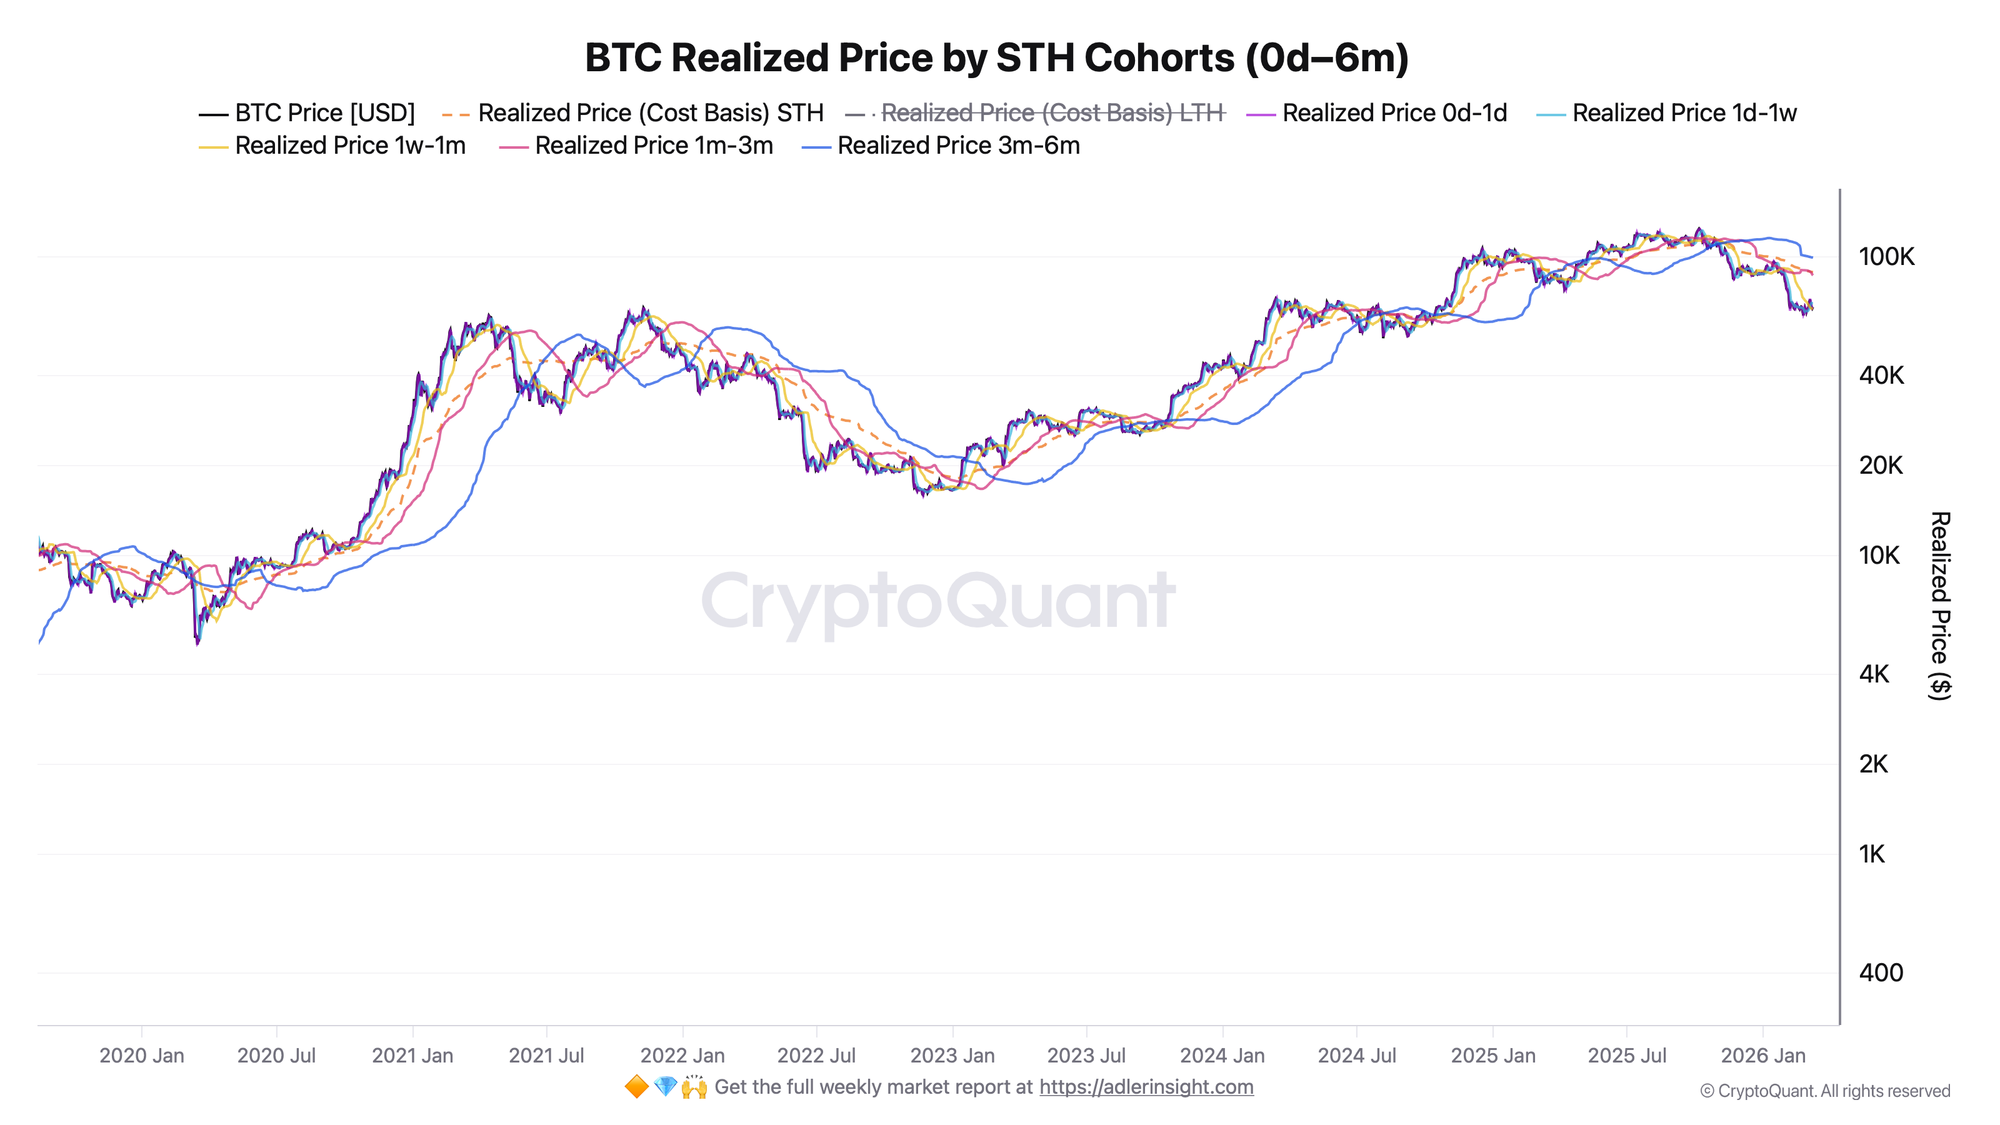
The metric reflects the average on-chain acquisition price for cohorts with holding horizons from 1 day to 6 months.
Current BTC price (~$67,976) sits below nearly all short-term cohorts and only approximately aligns with the 1w-1m zone ($67,135). The most pronounced imbalance remains in the 1m-3m ($86,791) and 3m-6m ($99,434) cohorts: participants who bought in November through February remain underwater by approximately 22% and 32% respectively. The aggregate STH Realized Price stands at $88,926, underscoring the scale of the gap between current price and the average cost basis of the short-term market.
The largest supply overhang remains concentrated in the 1m-3m and 3m-6m range - that is where a significant share of coins purchased well above current price resides. For this pressure to meaningfully ease, the market needs to reclaim at least the $86-89K zone, where the breakeven area for the bulk of the STH structure lies.
BTC Realized Price: LTH vs STH
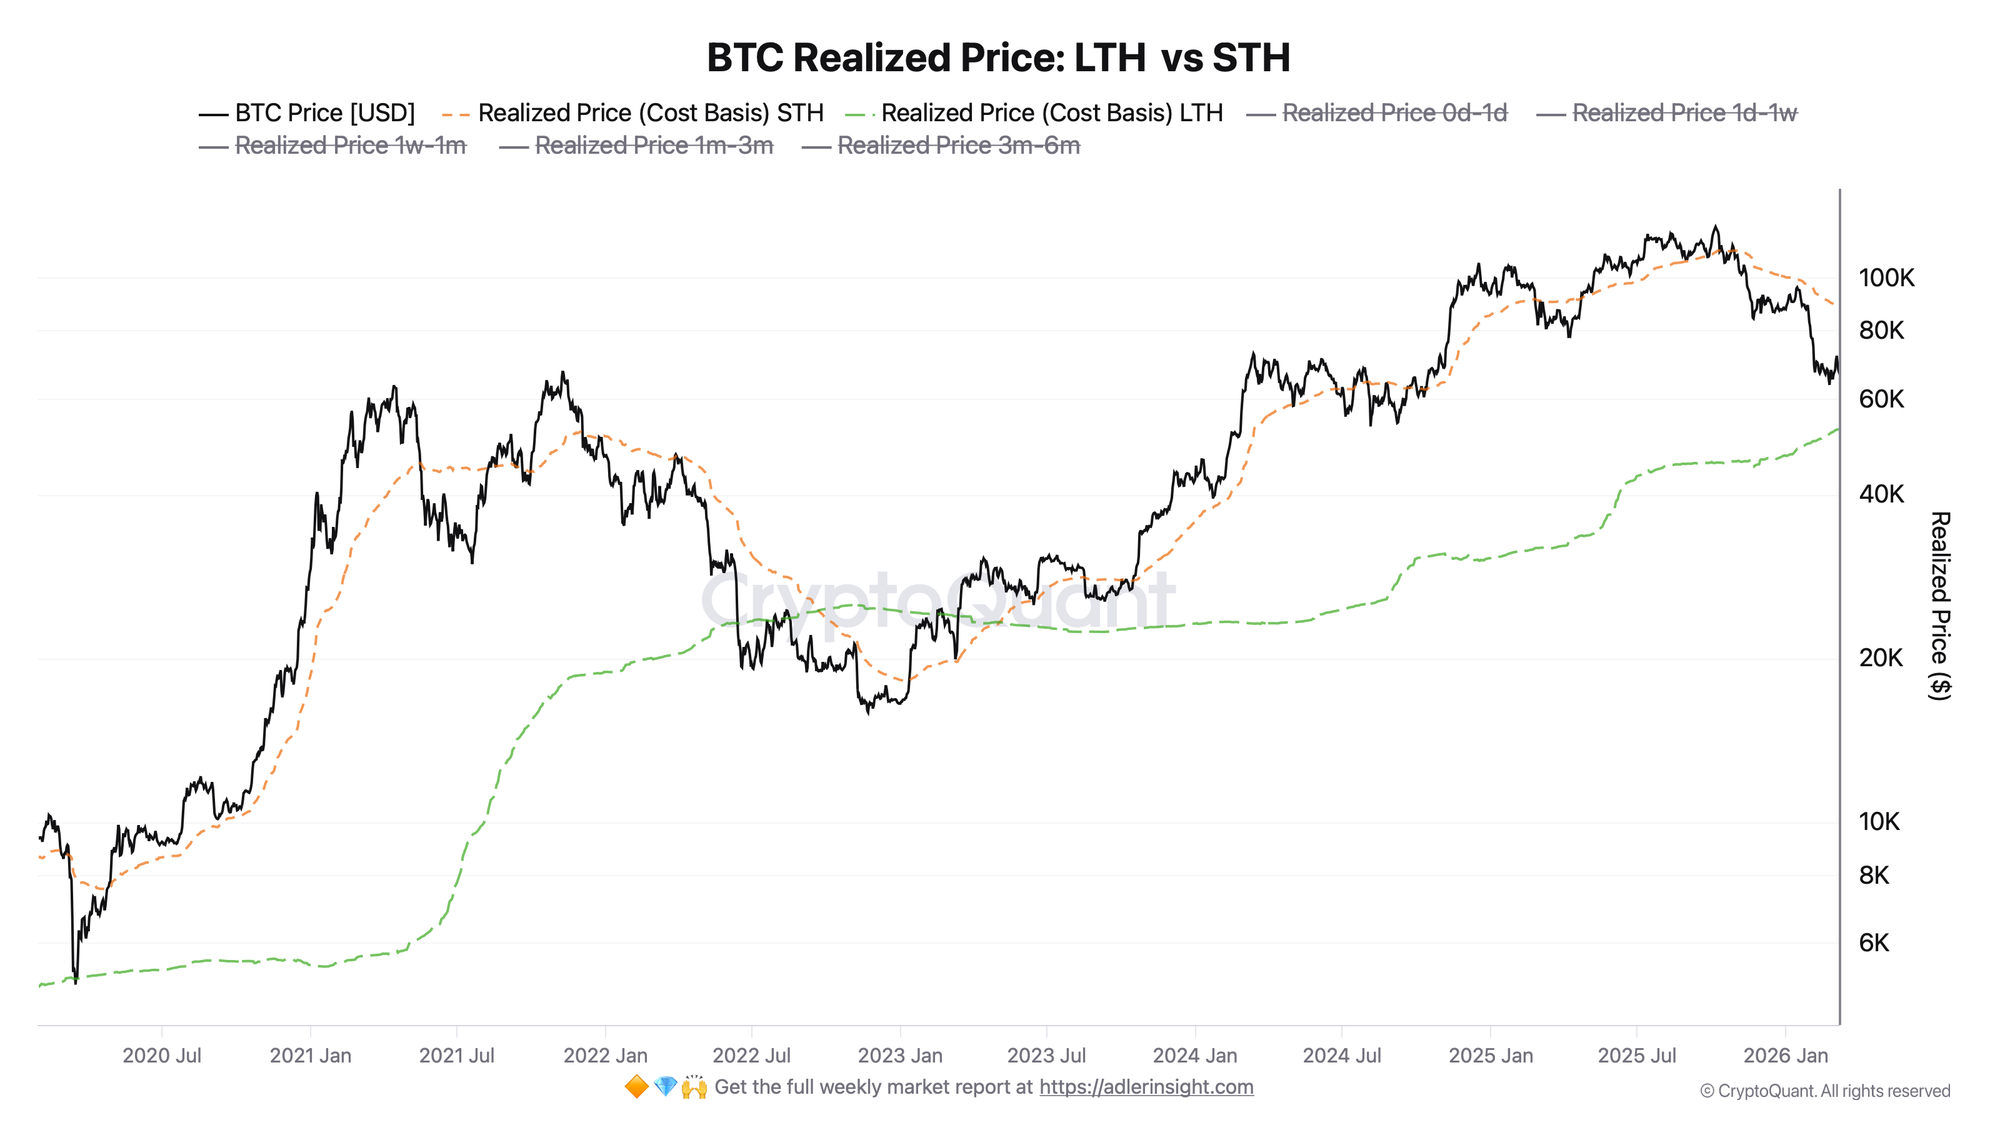
The metric allows assessment of the cycle phase through the gap between STH Realized Price and LTH Realized Price: the further price deviates below the STH base while retaining a buffer above the LTH base, the more clearly the market splits into underwater short-term holders and profitable long-term participants.
The LTH cohort maintains a realized cost basis of approximately $52,941, implying a buffer of around 28% relative to current price. This does not mean an absence of selling altogether, but suggests that in aggregate, long-term holders remain in a comfortable zone and do not appear to be a source of forced capitulation. As long as price holds above the $52-53K area, the LTH base continues to serve as the lower boundary of the long-term structure.
Link between charts: The gap between STH RP ($88.9K) and LTH RP ($52.9K) is approximately $36K. This configuration is characteristic of a late-stage correction following an overheated market phase: short-term participants are already under pressure, while long-term holders still maintain a profitable base. This looks more like a redistribution and digestion structure following the previous overheating than a confirmed start of a new upward impulse. The first sign of easing pressure could be a price return to the $70-72K range, however a full structural recovery will only begin upon a sustained close above the $86-89K zone.
Outperform Buy & Hold with a rules-based strategy - Start free. One weekly action, clear triggers, and invalidation levels. No guessing.
FAQ
What does it mean that price is below STH Realized Price? It means the average short-term holder is sitting on an unrealized loss. Historically, such periods are often accompanied by heightened market sensitivity to bounces and increased selling into strength, as some participants seek to reduce their loss on any price recovery.
What LTH RP level is critical as support? As long as price trades above LTH Realized Price ($52,941), long-term holders remain in aggregate profit. Historically, price falling below LTH RP has corresponded to more severe stages of capitulation, making this level the key lower boundary of the long-term structure.
CONCLUSIONS
The realized price structure points to sustained pressure from short-term holders: the main STH cohorts formed positions in the $87-99K range and are now sitting on notable losses, creating a persistent supply overhang at any price recovery. Long-term holders, by contrast, remain in profit territory at LTH RP of around $52.9K and show no signs of large-scale capitulation at the aggregate level. The overall picture is not a new trend, but a redistribution phase within a broad range. For the structure to improve, the market first needs to reclaim the $70-72K area as an early signal of easing pressure, and then establish itself above $86-89K, where the key breakeven zone for the STH cohort lies. The primary risk is a loss of the lower part of the current range, followed by an acceleration of selling from underwater short-term holders and a price shift toward the LTH base.
Further Reading
Core metrics for this brief:
- Bitcoin STH Realized Price: Definition, Formula & Cost Basis Framework
- Bitcoin LTH vs STH: Supply Dynamics, Cost Basis & Market Structure
- STH vs LTH Realized Price: Support & Resistance Guide
- Bitcoin Realized Price Bands Explained: Cycle Analysis, Signals, and Historical Examples
Related on-chain context: