
🎧 Morning Brief #136 - audio debate on today’s market setup
Short-term holders remain in unrealized loss territory across two metrics simultaneously. STH Realized Price YoY turned negative back in February and has continued declining to -5.35% as of March 30. STH SOPR has held below 1.0 for more than 110 consecutive days, signaling systematic loss realization by this group of participants.
TL;DR
Short-term holders remain in prolonged stress mode: their realized price sits above the market and SOPR is below unity. Until BTC returns above the STH cost basis and SOPR consolidates above 1.0, downward pressure on price will persist.
Bitcoin Short-term Holder (STH) Realized Price
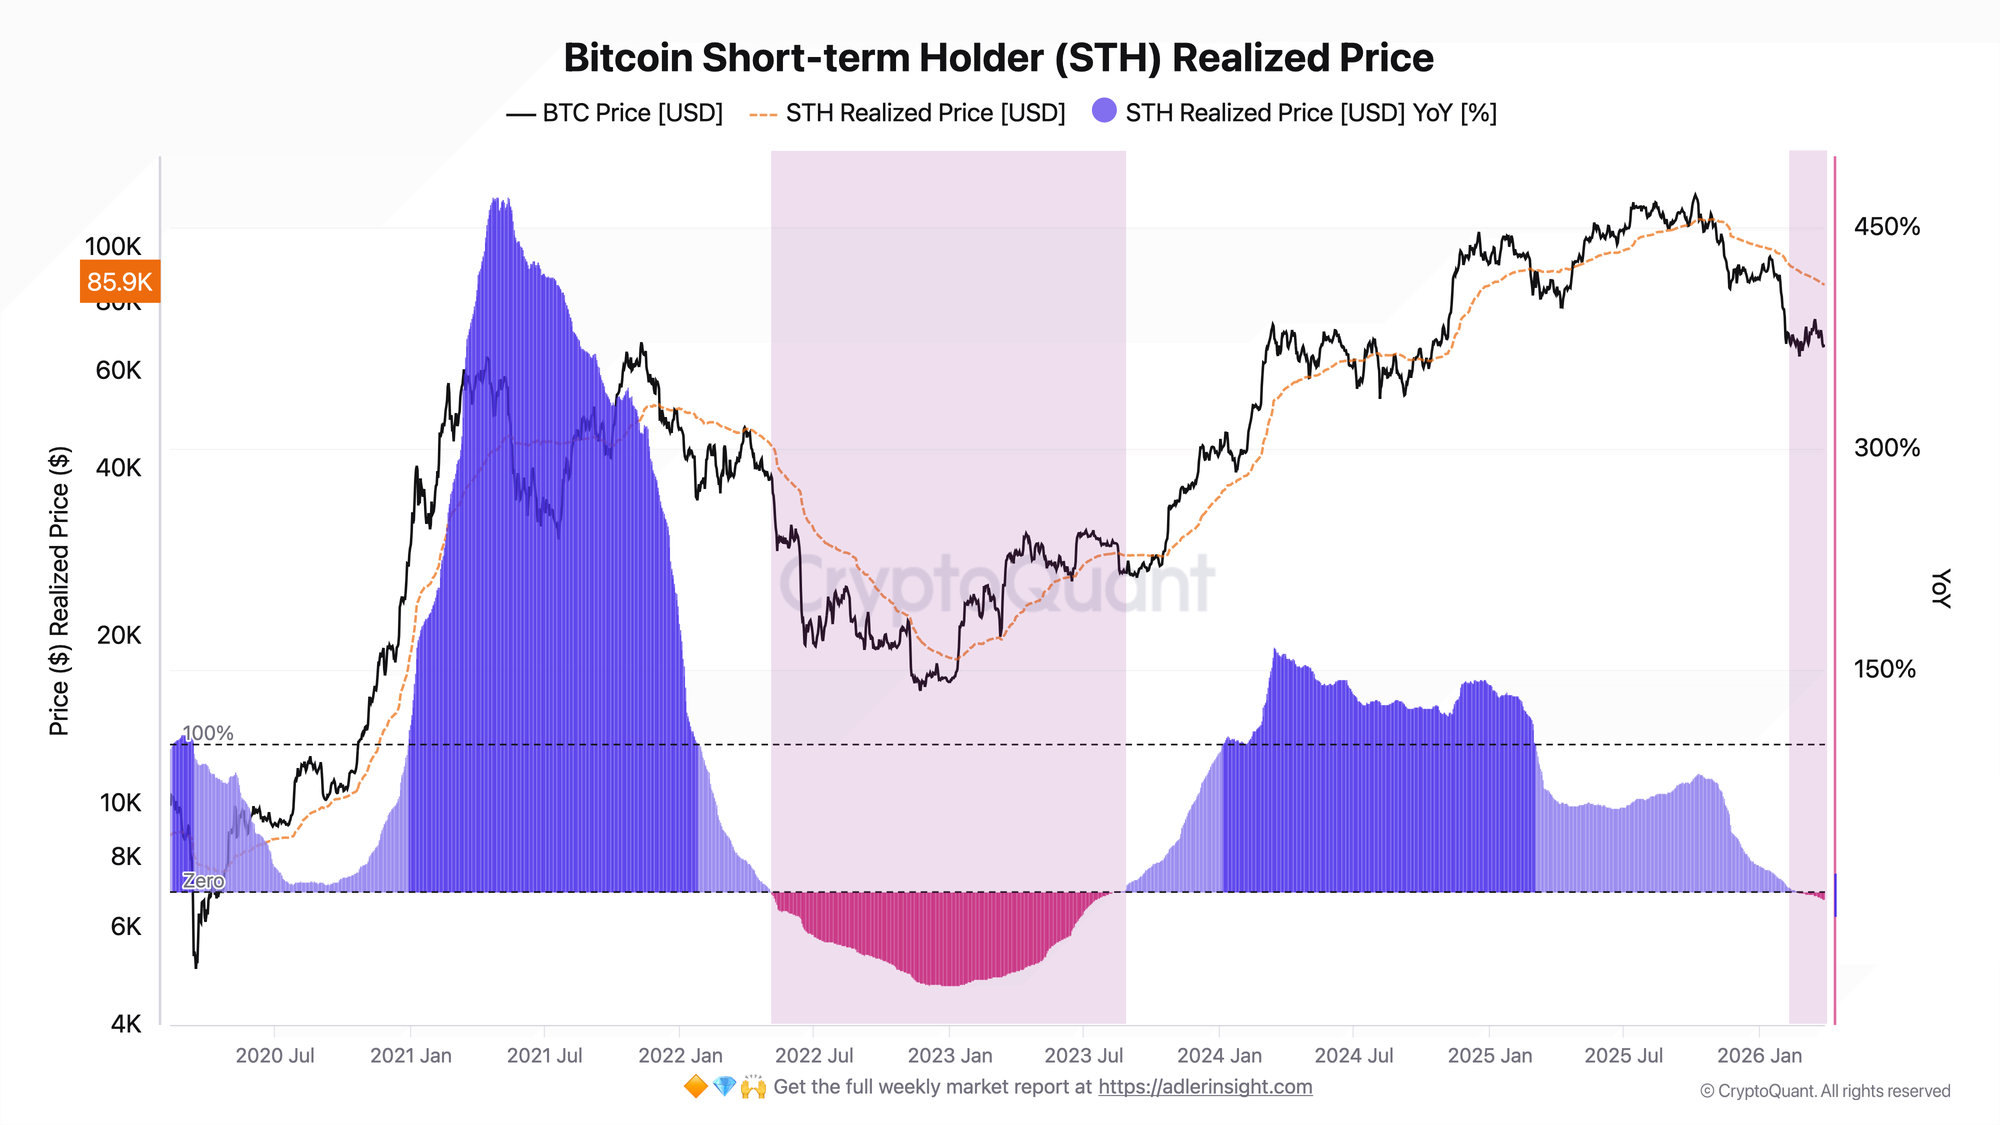
STH Realized Price is the average acquisition price of coins held for less than 155 days. As of March 30, 2026, it stands at $85,831, while the BTC market price is near $66,946. The spread between the realized and market price exceeds $18,000 - meaning the average short-term holder is underwater. The STH Realized Price YoY has dropped to -5.35% - the first sustained negative reading since the 2022 bear market. The YoY crossover below zero occurred on February 21, 2026, and since then the decline has accelerated: over six weeks the indicator moved from zero to -5.35% without any meaningful recovery.
Historically, the combination of two conditions - STH Realized Price above the market price and a negative YoY - corresponds to a phase of weak demand in which short-term participants are already carrying a loss, but the market has yet to return them to profitability. The trigger for a regime change will be a BTC recovery above the $85,000-86,000 area, where STH Realized Price is located. That is the level at which the average short-term holder stops being underwater.
Bitcoin: Short Term Holder SOPR
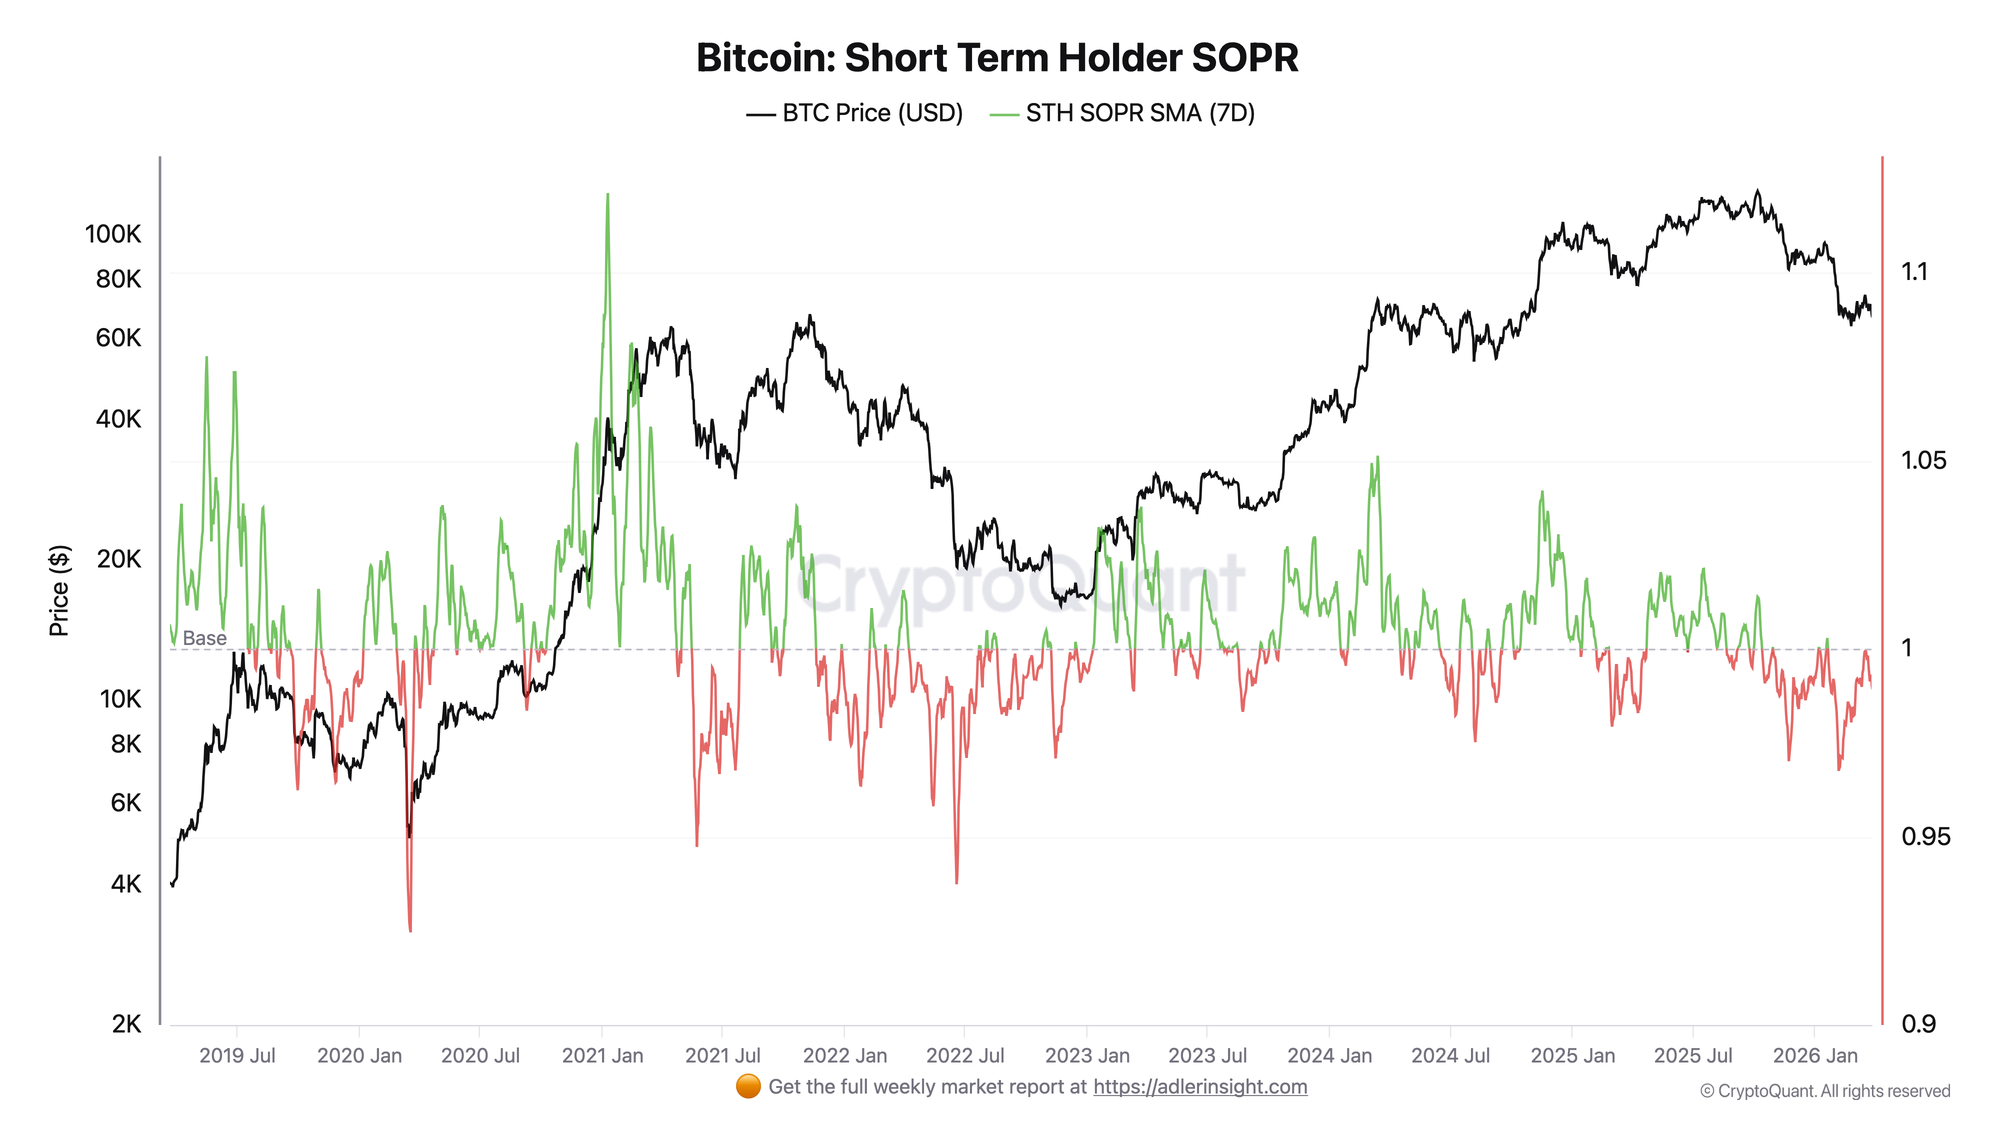
STH SOPR (Spent Output Profit Ratio) measures whether short-term holders are moving their coins at a profit or a loss. A reading below 1.0 means that coins are being sold below their acquisition price - that is, with a realized loss. SOPR (7D SMA) dropped below 1.0 back in December 2025 and has since failed to sustain a recovery above that threshold - a total of more than 110 days. The local minimum was recorded on February 5, 2026 at 0.968, after which a partial recovery followed, but by the end of March SOPR had pulled back again to 0.989 - near the lower bound of the range seen over recent weeks. In a broader historical context, similar extended periods below 1.0 accompanied the bear market phases of 2022 and the correction in the second half of 2021.
The current reading of 0.989 indicates persistent, if moderate, selling pressure. Confirmation of a regime change requires a sustained SOPR recovery above 1.0 and a hold there for at least several consecutive days. That would be the first signal that short-term holders have resumed moving coins at a profit rather than capitulating into weakness.
Both metrics tell the same story from different angles. STH Realized Price reveals structural loss at the cost-basis level, while STH SOPR confirms it through the actual on-chain behavior of coins. As long as price remains materially below STH Realized Price and SOPR stays below 1.0, the market will continue to face pressure from participants looking to cut their loss or break even on any recovery.
👀 Reading the signal is not enough - you need to act on it. Weekly Engine turns on-chain data into one clear decision per week, with risk caps and invalidation built in. Start free.
FAQ
What does a negative STH Realized Price YoY mean? It means that STH Realized Price is currently lower than it was a year ago. On its own, this signal does not indicate capitulation, but combined with the fact that the current BTC price sits significantly below STH Realized Price, it reflects weakening demand and a deteriorating position for short-term holders. This bearish condition was last seen in a sustained form during the 2022 bear market.
Under what condition will pressure from short-term holders begin to ease? The key trigger is a BTC recovery above the STH Realized Price level (~$85,000-$86,000). This would move the average short-term holder from loss into profit, reduce the incentive to sell at breakeven, and create the conditions for SOPR to recover above 1.0.
CONCLUSIONS
Both indicators paint a consistent picture: short-term holders are in a prolonged stress regime. STH Realized Price YoY has turned negative - for the first time in the current cycle - and continues to decline, reaching -5.35% by March 30. STH SOPR has held below 1.0 for more than 110 days, registering systematic loss realization. This combination points to a weak market environment for short-term upside: the structure does not support a sustained recovery until price returns to the $85,000+ area and relieves the loss burden on the STH cohort. The primary trigger for a regime change is a break and hold above STH Realized Price accompanied by a simultaneous SOPR recovery above 1.0. The primary risk is further price decline, which would deepen pressure within this cohort and could trigger a fresh wave of forced selling.
Further Reading
Direct topic - STH cost basis & SOPR
- Bitcoin STH Realized Price: Definition, Formula & Cost Basis Framework
- Bitcoin STH SOPR: What It Is and How to Use It
- Bitcoin Short-Term Holder Profitability: Break-Even as Bull/Bear Signal
- STH vs LTH Realized Price: Support & Resistance Guide
- Bitcoin LTH vs STH: Supply Dynamics, Cost Basis & Market Structure
Broader on-chain context
- Bitcoin Realized Price Bands Explained: Cycle Analysis, Signals, and Historical Examples
- Bitcoin NUPL (Net Unrealized Profit/Loss): What It Is and How to Use It
- Bitcoin Supply in Profit: Definition, Thresholds & Market Signals
- Realized Profit vs Unrealized Profit: What's the Difference
- Realized Price UTXO Age Bands: Definition & HODLer Signals