
Discover how Global M2 and Spot ETF netflows are overriding the traditional Bitcoin halving cycle. Learn the thresholds, SQL formulas, and how to trade them.
TL;DR
- What it is: A macro-valuation framework that measures fiat liquidity (Global M2 YoY) and structural demand (Spot ETF Netflows) against Bitcoin's fixed supply schedule.
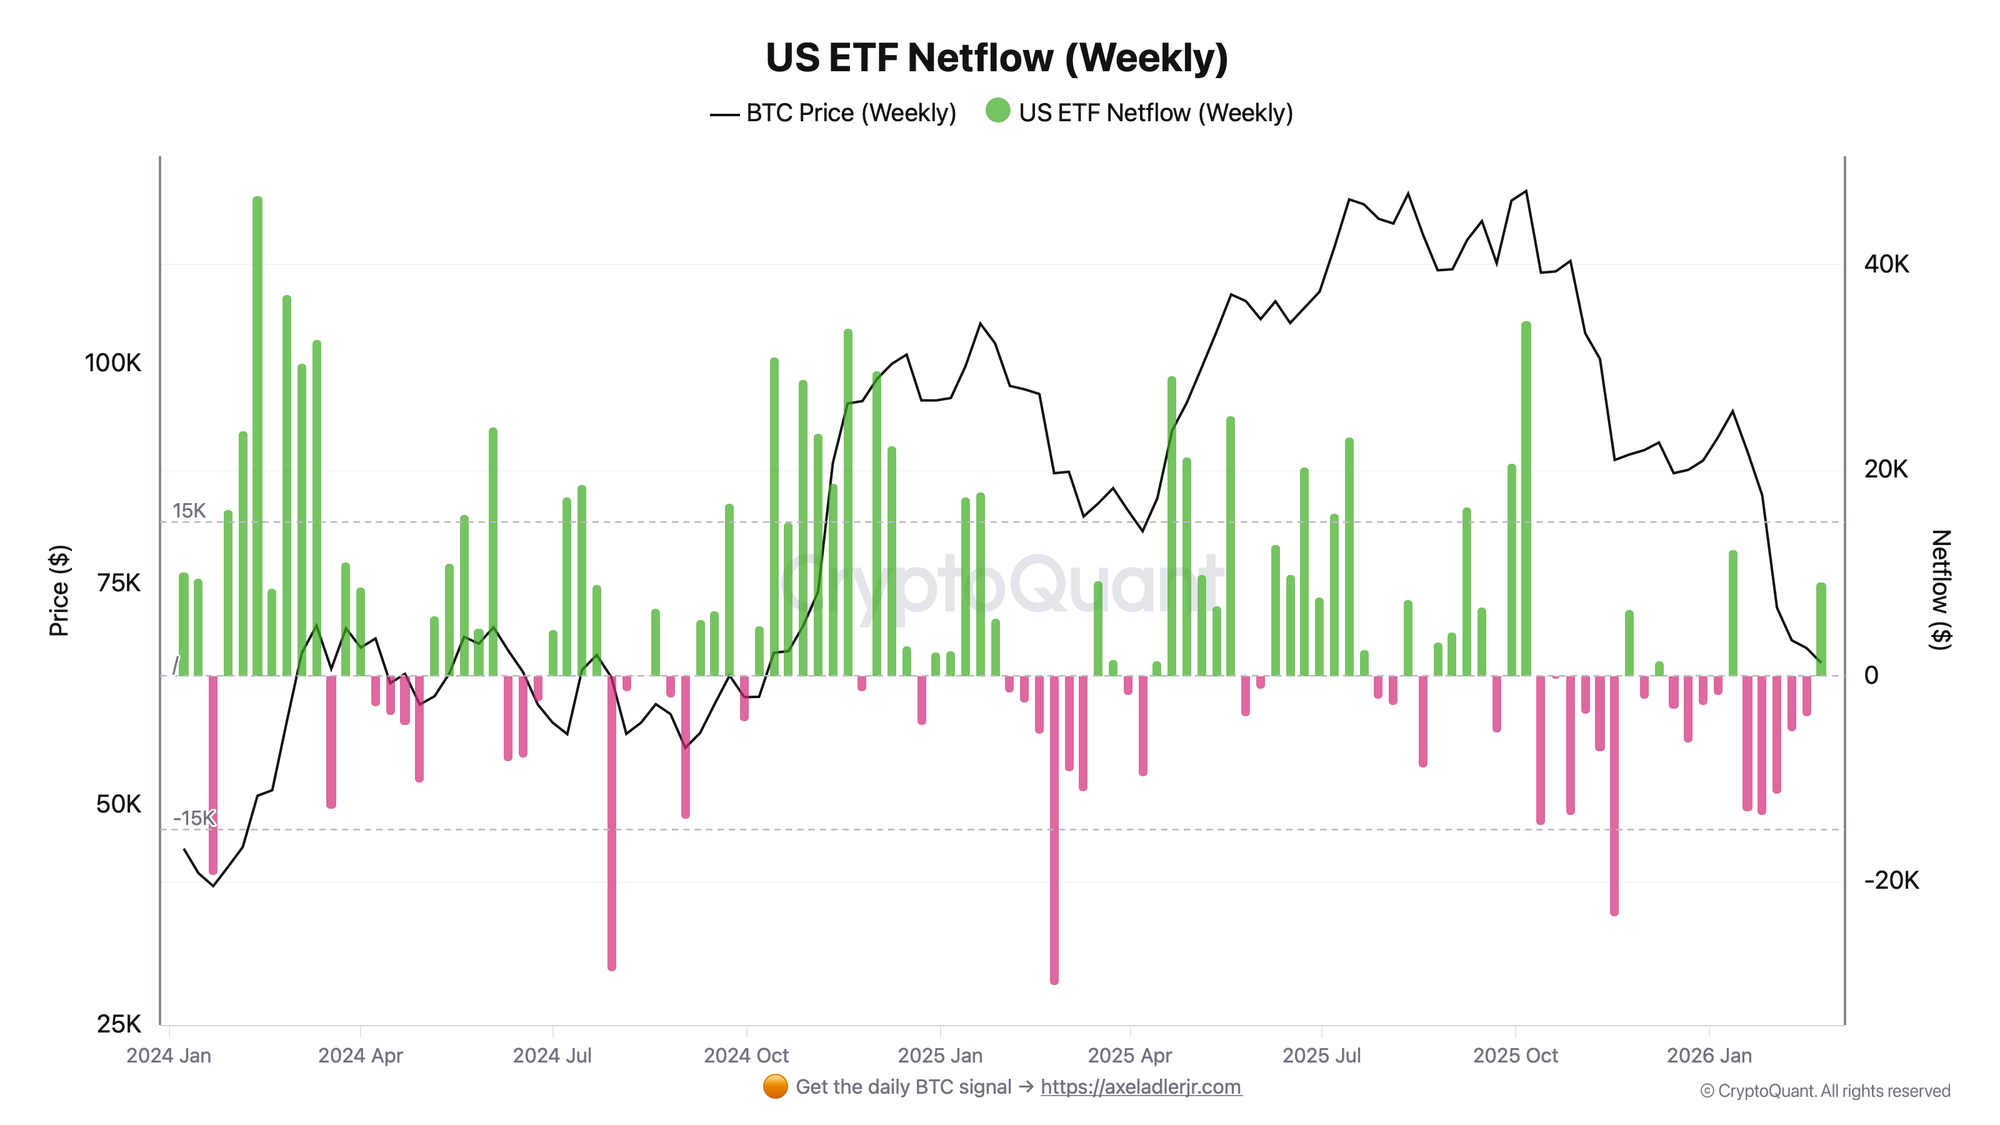
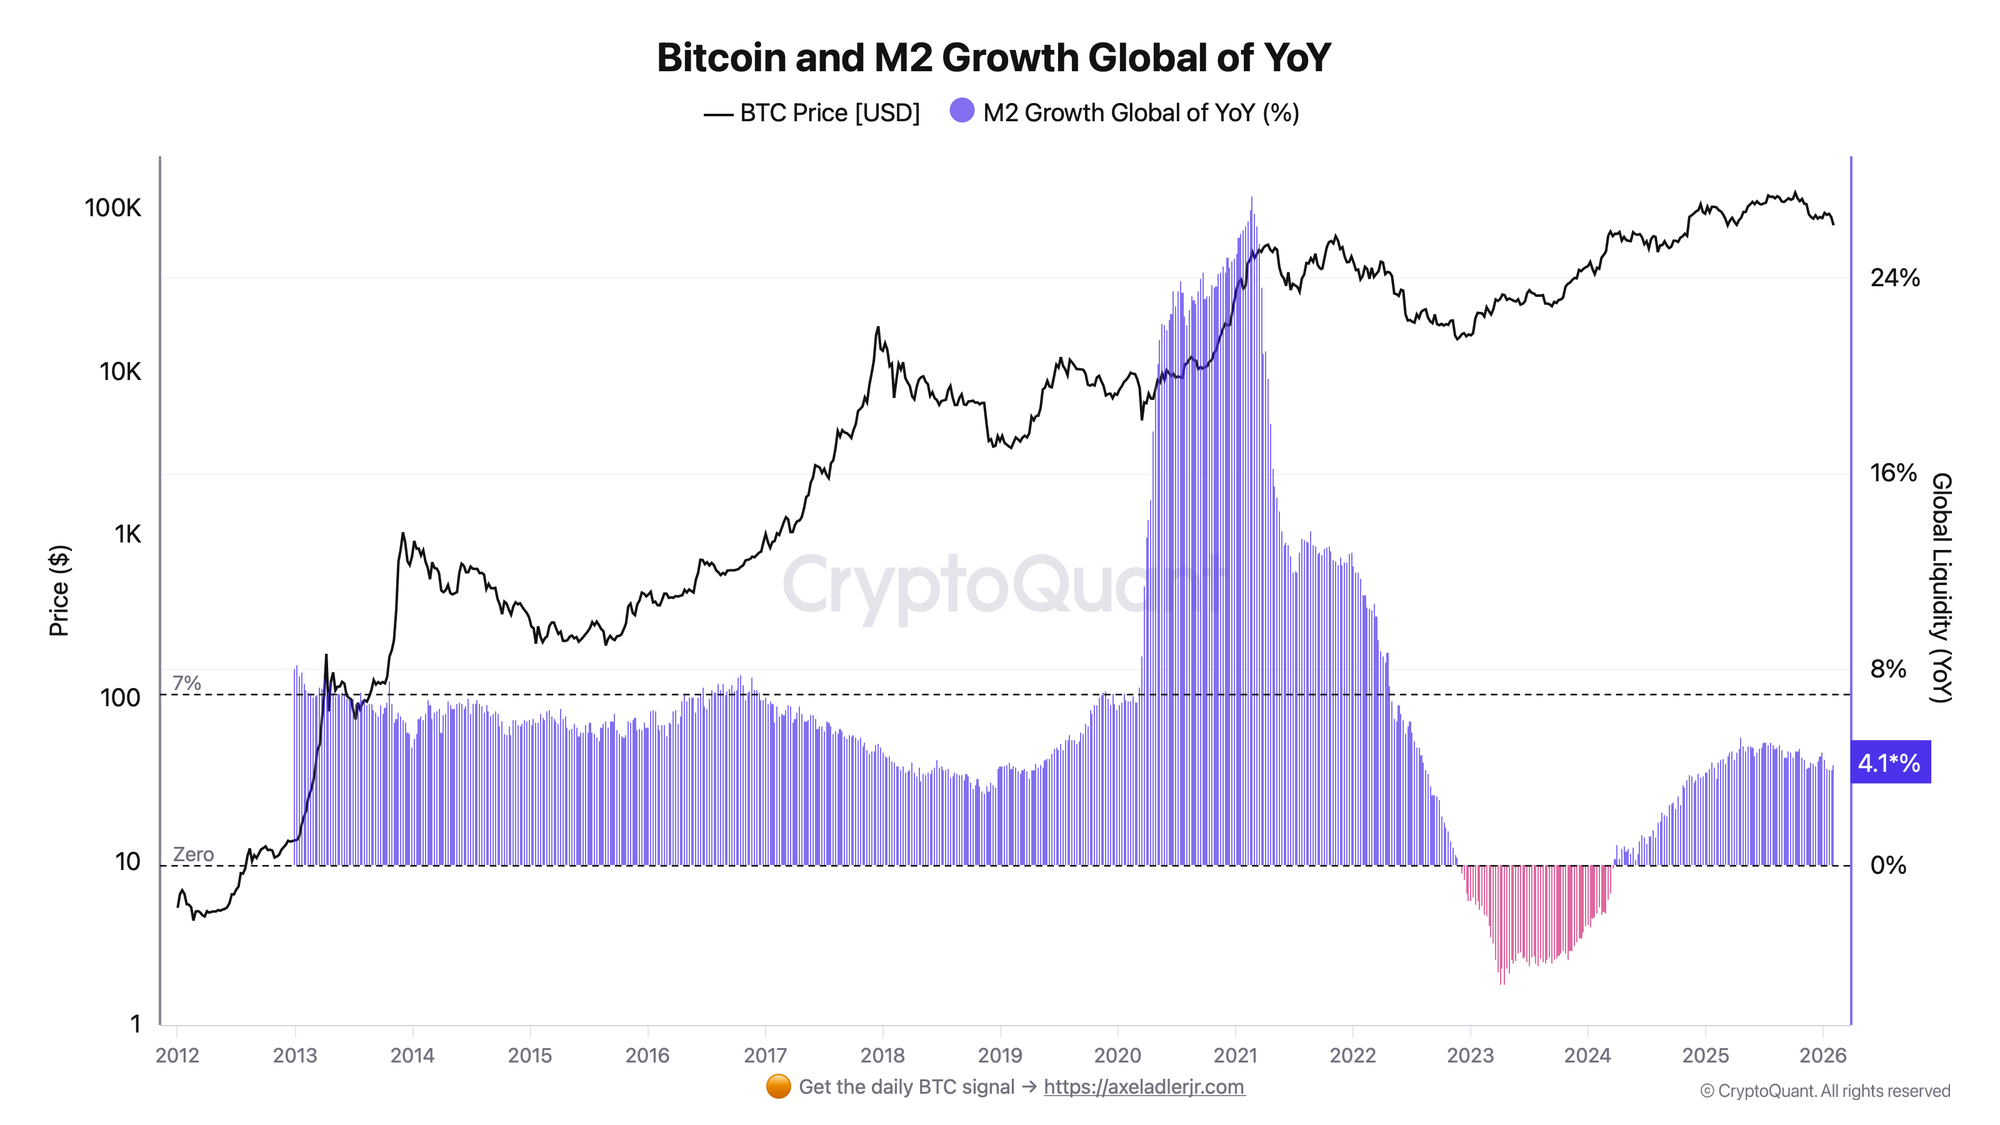
- How it’s calculated: We measure the Year-over-Year (YoY) percentage change in Global M2 money supply, combined with the 7-day rolling sum of US Spot ETF net inflows.
- What "Up/Down" means: Expanding M2 + positive ETF inflows = bullish (cycle acceleration). Contracting M2 + negative ETF outflows = bearish (cycle suppression).
- Core practical takeaway: Macro liquidity and ETF inflows now dictate cycle timing and drawdowns more than the 210,000-block halving schedule.
- Context/false signals: ETF inflow reports can lag actual price movements; buying purely on backward-looking ETF prints during extreme greed (for example, MVRV > 5) is a trap.
- The mini-rule: Signal triggers bullish when Global M2 YoY flips from negative to positive AND weekly US ETF netflows sustain > 5,000 BTC for two consecutive weeks.
The signal rule
Formula:
Cycle Strength = (Global M2 YoY Growth > 0%) + (Weekly ETF Netflow > 0)
Thresholds and window:
- Bullish: M2 YoY > 2.0% AND Weekly ETF netflows > 10,000 BTC. This indicates strong fiat liquidity expansion combined with direct institutional buying.
- Bearish: M2 YoY < 0% (contraction) AND Weekly ETF netflows < -2,000 BTC. The halving supply shock will not save the price in this environment.
- Neutral: M2 is flat (0% to 1%), and ETF flows are mixed. The market reverts to standard
days_into_cycleand miner dynamics.
Examples:
- If M2 YoY turns negative (as it did during the 2022 tightening cycle), then the market can remain in a severe bear phase regardless of where we are in the 4-year cycle.
- If spot ETF demand absorbs a large share of net new supply for multiple weeks, then cycle timing can shift forward (including pre-halving highs), breaking the historical pattern.
SQL / Code snippet
Calculates weekly Global M2 YoY growth against weekly Bitcoin price (BigQuery-compatible). This version actually aggregates to weekly data so the YoY LAG(52) is consistent.
-- Weekly (Sunday) aggregation + YoY change (52 weeks)
WITH price_daily AS (
  SELECT
    DATE(datetime) AS day,
    c AS price
  FROM `tech-web3-analytics-prod.abstraction_price.btc_usd_index-price_day`
  WHERE DATE(datetime) >= '2012-01-01'
),
m2_daily AS (
  SELECT
    DATE(event_timestamp) AS day,
    AVG(value) AS m2_value
  FROM `poc_stage.tradfi_fred_dataset`
  WHERE type = 'm2' AND DATE(event_timestamp) >= '2012-01-01'
  GROUP BY 1
),
price_weekly AS (
  SELECT
    DATE_TRUNC(day, WEEK(SUNDAY)) AS week,
    AVG(price) AS price
  FROM price_daily
  GROUP BY 1
),
m2_weekly AS (
  SELECT
    DATE_TRUNC(day, WEEK(SUNDAY)) AS week,
    AVG(m2_value) AS m2_value
  FROM m2_daily
  GROUP BY 1
)
SELECT
  w.week,
  p.price,
  100 * SAFE_DIVIDE(p.price - LAG(p.price, 52) OVER (ORDER BY w.week),
                    LAG(p.price, 52) OVER (ORDER BY w.week)) AS price_yoy,
  100 * SAFE_DIVIDE(m.m2_value - LAG(m.m2_value, 52) OVER (ORDER BY w.week),
                    LAG(m.m2_value, 52) OVER (ORDER BY w.week)) AS m2_yoy
FROM (SELECT week FROM m2_weekly UNION DISTINCT SELECT week FROM price_weekly) w
LEFT JOIN price_weekly p USING (week)
LEFT JOIN m2_weekly m USING (week)
ORDER BY 1 DESC;
Key definitions
- Global M2 YoY: The year-over-year percentage change in the total supply of currency and highly liquid assets circulating in the global economy.
- Spot ETF netflow: The absolute daily or weekly difference between capital entering and leaving US-listed spot Bitcoin ETFs.
- Halving block subsidy: The deterministic reduction in new Bitcoin issuance (currently 3.125 BTC per block), which has historically anchored the 4-year cycle.
How to interpret this metric
- Bullish case: When Global M2 YoY growth is accelerating and spot ETF flows show sustained weekly net-positive inflows. In this regime, fiat liquidity pushes capital into risk assets, and ETFs act as a direct structural vacuum for Bitcoin's fixed supply. Expect cycle highs to stretch higher or occur earlier than the traditional day-500 timeline.
- Bearish case: M2 YoY turns negative (central bank tightening) accompanied by ETF net-outflows. Liquidity is draining from the system. In this state, the mechanical reduction of miner supply (halving) can be overpowered by macro sell pressure.
- Neutral case: M2 growth is stagnant and ETF flows chop between positive and negative. The market is waiting for a macro catalyst.
- What matters most: The macro trend of M2 (months) combined with cumulative ETF flow (weeks), rather than a single day of ETF outflows.
Historical examples (what worked, what didn’t)
- Q1 2024 (the pre-halving ATH):
- Indicator: Spot Bitcoin ETFs saw net inflows of roughly $12B in Q1 2024.
- Result: Bitcoin hit an all-time high before the halving event for the first time in history.
- Context: Structural demand routed through ETFs compressed cycle timing and overpowered the standard early-cycle accumulation narrative.
- Indicator: Spot Bitcoin ETFs saw net inflows of roughly $12B in Q1 2024.
- Late 2022 (macro overload):
- Indicator: Broad money growth rolled over during the 2022 tightening cycle and liquidity conditions deteriorated sharply.
- Result: Bitcoin reached the deep bear market low around ~$15,900.
- Context: Even deep into the historical cycle window, liquidity drawdowns can dominate the halving schedule.
- Indicator: Broad money growth rolled over during the 2022 tightening cycle and liquidity conditions deteriorated sharply.
How to use it in practice
- Setup: You track
days_into_cycle(for example, nearing the historical day-500 top zone) but want to know if liquidity will extend or cut the cycle short. - Trigger: Global M2 YoY crosses above 4% AND weekly ETF netflows remain positive for 3 consecutive weeks.
- Confirm: Confirm with the MVRV Z-Score (remaining below 5.0 suggests room without overheating) and STH SOPR (bouncing off 1.0).
- Invalidates when: Liquidity conditions tighten materially (for example, M2 re-accelerates downward) or consecutive ETF outflow weeks exceed -10,000 BTC total.
- Action: Scale into positions when M2 flips positive; begin taking profit if M2 growth stalls and ETF flows turn negative for a multi-week period, regardless of what "cycle day" it is.
Common pitfalls
- Ignoring the ETF settlement/reporting lag: ETF flow data is typically reported end-of-day. Trading purely on yesterday's flow means you are reacting to priced-in data. Filter: use ETF flows for weekly trend strength, not intraday entries.
- Confusing nominal M2 with YoY M2: The absolute number of M2 always looks large. Filter: the YoY rate of change (acceleration/deceleration) is what matters for macro regimes.
- Assuming ETFs only buy: In a macro downturn, ETFs can become a source of liquid supply. Filter: watch for consecutive outflow weeks during M2 contraction to identify regime shifts early.
Halving supply shock vs fiat liquidity
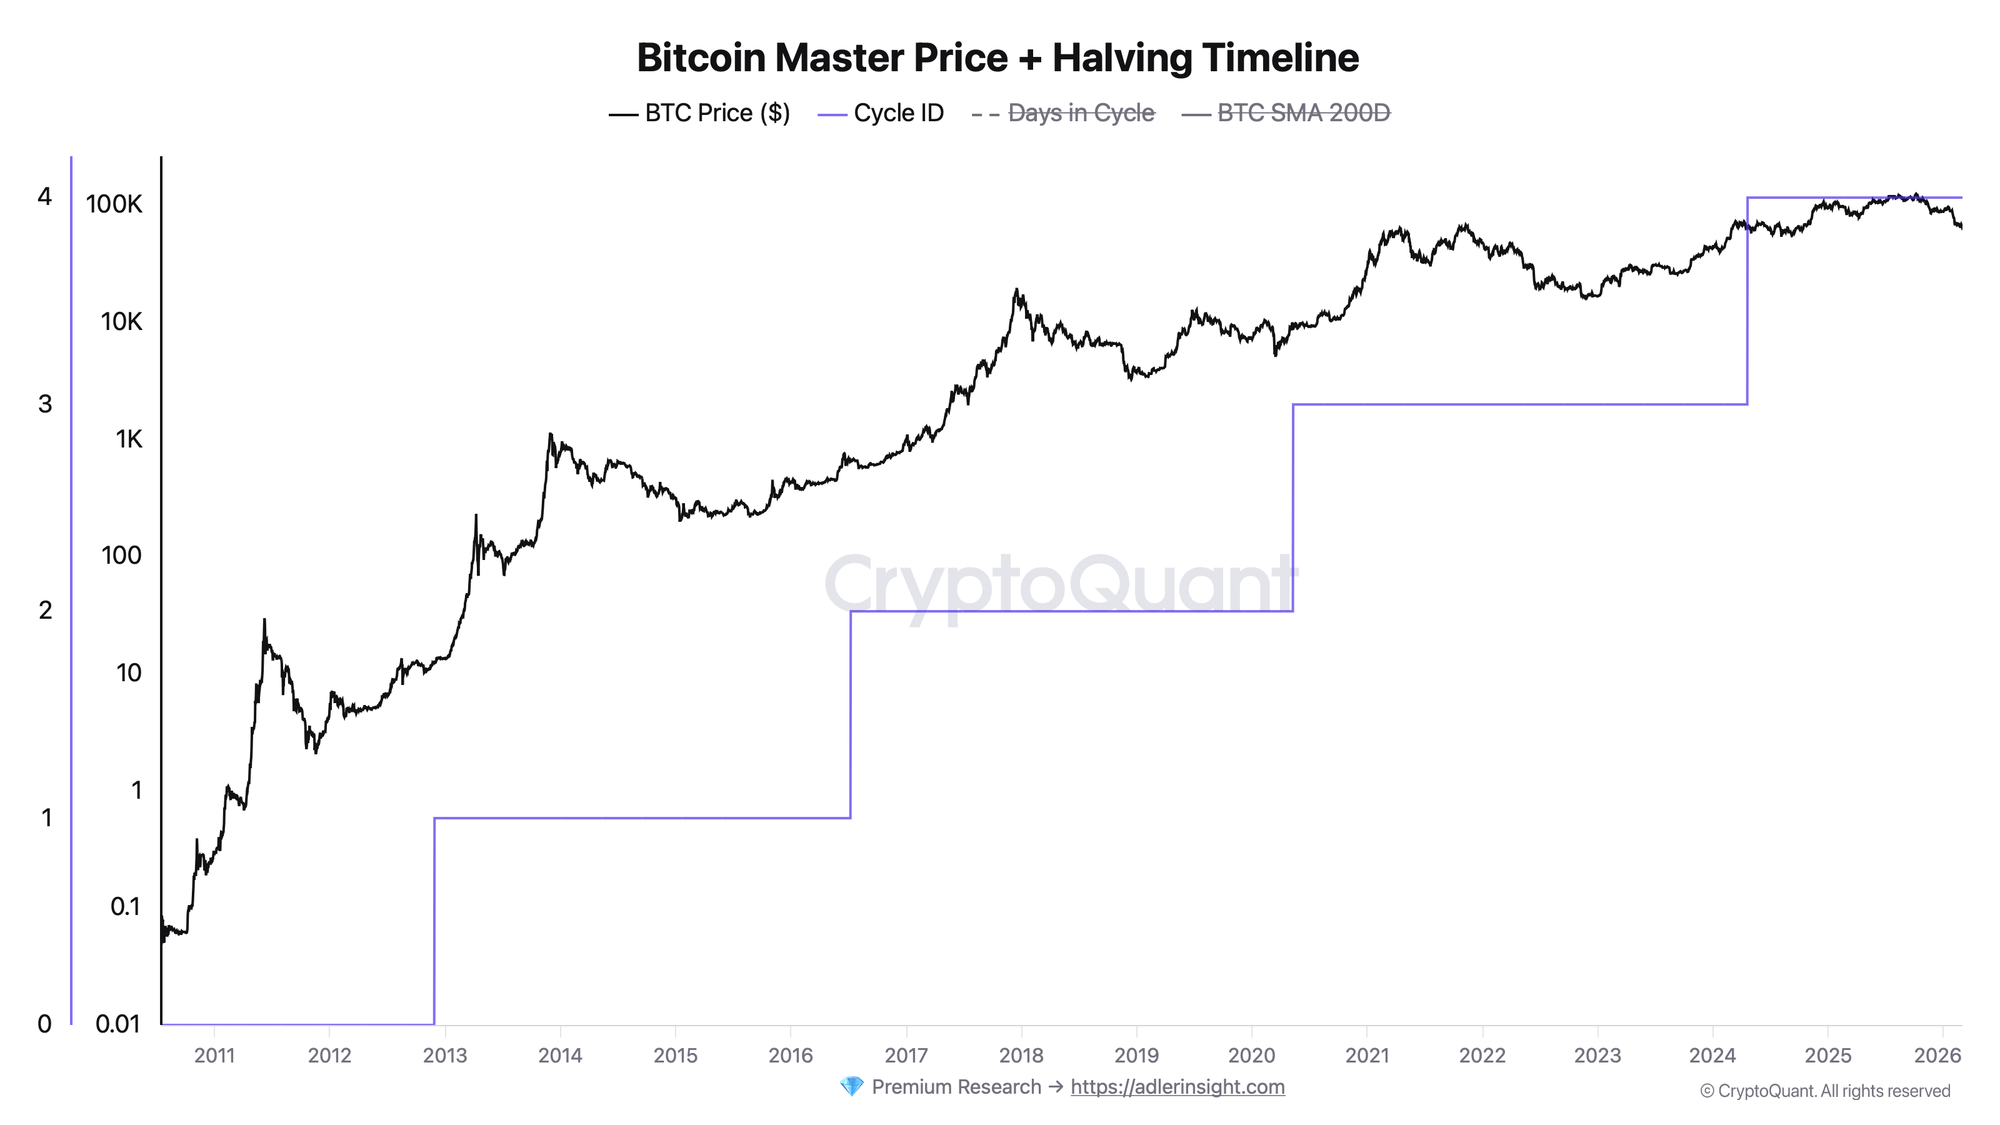
- Halving supply: Reduces issuance mechanically (for example, ~900 BTC/day to ~450 BTC/day). Predictable, but impact diminishes as market cap grows.
- Fiat liquidity (M2/ETF): Introduces large, variable demand shocks (for example, ETFs absorbing multiples of net new issuance in strong weeks). Less predictable but can carry more marginal price impact than the halving.
FAQ
- Q: Does the 4-year cycle still work after spot ETFs?
- A: The cycle phases (accumulation, bull, distribution, bear) remain, but timing and magnitude are now more sensitive to ETF flows and macro liquidity.
- A: The cycle phases (accumulation, bull, distribution, bear) remain, but timing and magnitude are now more sensitive to ETF flows and macro liquidity.
- Q: Where can I find Global M2 data?
- A: You can source it from aggregated central bank datasets, or construct a proxy index from major regions. (FRED is useful for US series; global requires aggregation.)
- A: You can source it from aggregated central bank datasets, or construct a proxy index from major regions. (FRED is useful for US series; global requires aggregation.)
- Q: What is a significant weekly ETF netflow value?
- A: As a practical rule, consecutive weeks of > 5,000 BTC net inflows imply strong demand, while consecutive outflows below -2,000 BTC can signal distribution.
- A: As a practical rule, consecutive weeks of > 5,000 BTC net inflows imply strong demand, while consecutive outflows below -2,000 BTC can signal distribution.
- Q: Why did Bitcoin drop in 2022 when the cycle should have bottomed?
- A: Liquidity conditions tightened aggressively during 2022, overpowering the historical cycle timing.
- A: Liquidity conditions tightened aggressively during 2022, overpowering the historical cycle timing.
Related guides
- Overview: The 4-Year Bitcoin Cycle: Definition, Mechanics & Historical Evidence
- Confirmations: MVRV Z-Score: How to Identify Bitcoin Market Tops and Bottoms
- Confirmations: Bitcoin STH SOPR: What It Is and How to Use It
- Capitulation triggers: Bitcoin Hash Ribbons: Capitulation Signals & Buy Triggers
- Miner data: Bitcoin Puell Multiple: Definition, Formula & Miner Signals
Minimal conclusion
- Global M2 YoY is the macro engine; spot ETFs are the transmission mechanism into Bitcoin.
- The 4-year cycle sets a baseline schedule, but M2 and ETFs can dictate actual highs and lows.
- Do not trade the halving schedule blindly without checking current liquidity regimes.
- Next step: Learn how to time macro tops by combining ETF flows with MVRV Z-Score: How to Identify Bitcoin Market Tops and Bottoms.