
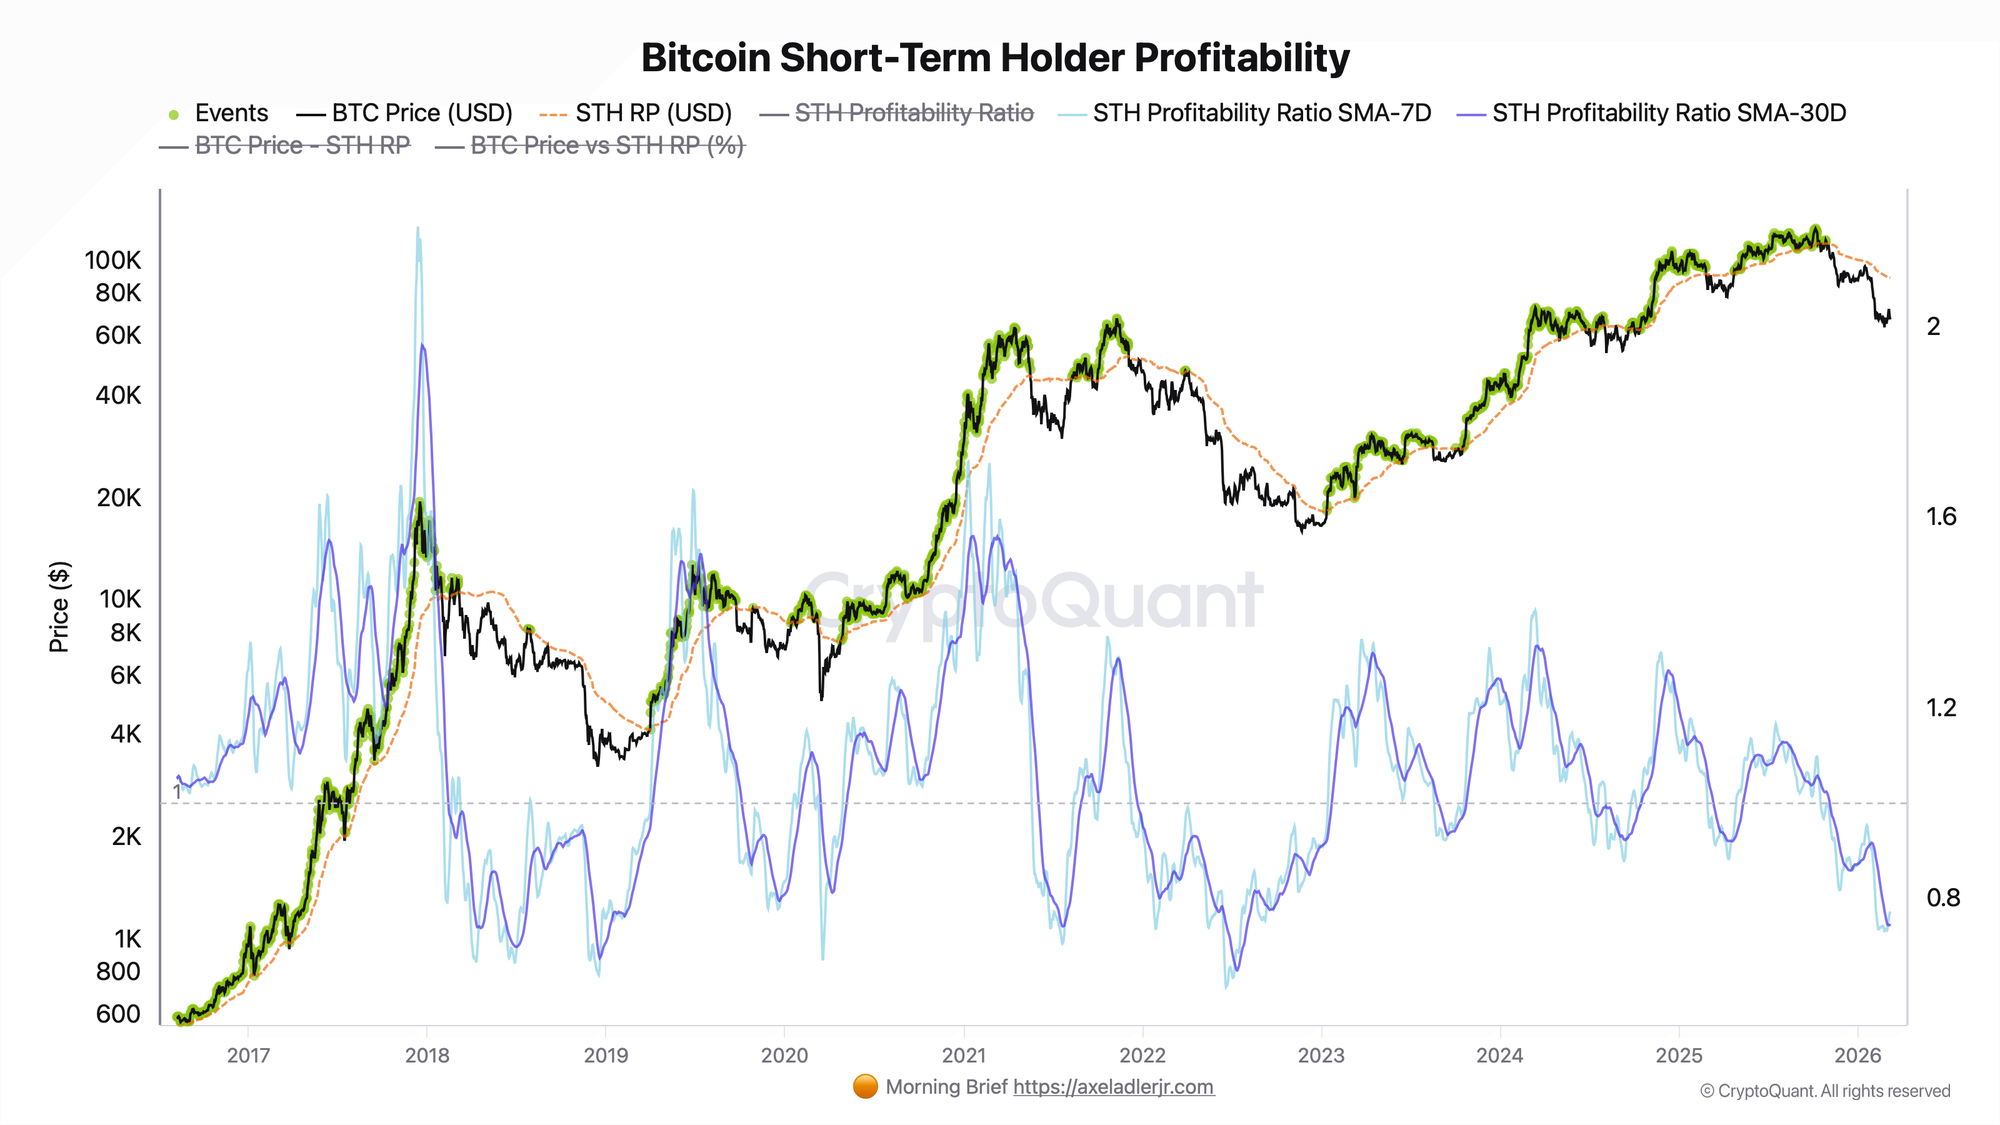
Short-Term Holder Profitability measures whether Bitcoin bought in the last 6 months is worth more or less than its acquisition cost. When the ratio crosses 1.0 - the break-even line - it flags a structural regime shift that has preceded major trend moves in every cycle since 2017.
TL-DR
- What it is: STH Profitability Ratio = BTC Price / STH Realized Price (cost basis of coins held 0-6 months)
- How it is calculated: divide spot price by the average acquisition price of all STH supply
- Above 1.0: short-term holders are in aggregate profit - bullish regime
- Below 1.0: short-term holders are in aggregate loss - bearish regime
- Key signal: the cross of 1.0 (either direction) is the trigger, not the level itself
- Caveat: choppy markets near 1.0 generate frequent false crosses - always confirm with SMA-30 and volume context
Signal rule: "Bull regime confirmed when STH Profitability Ratio closes above 1.0 and SMA-30 is rising. Bear regime confirmed when ratio closes below 1.0 and SMA-30 is declining."
The Signal Rule
Formula:
STH Profitability Ratio = BTC Price / STH Realized Price
Where STH Realized Price is:
STH Realized Price =
  (realized_supply_0d_1d_usd + realized_supply_1d_1w_usd + realized_supply_1w_1m_usd
   + realized_supply_1m_3m_usd + realized_supply_3m_6m_usd)
  /
  (supply_0d_1d + supply_1d_1w + supply_1w_1m + supply_1m_3m + supply_3m_6m)
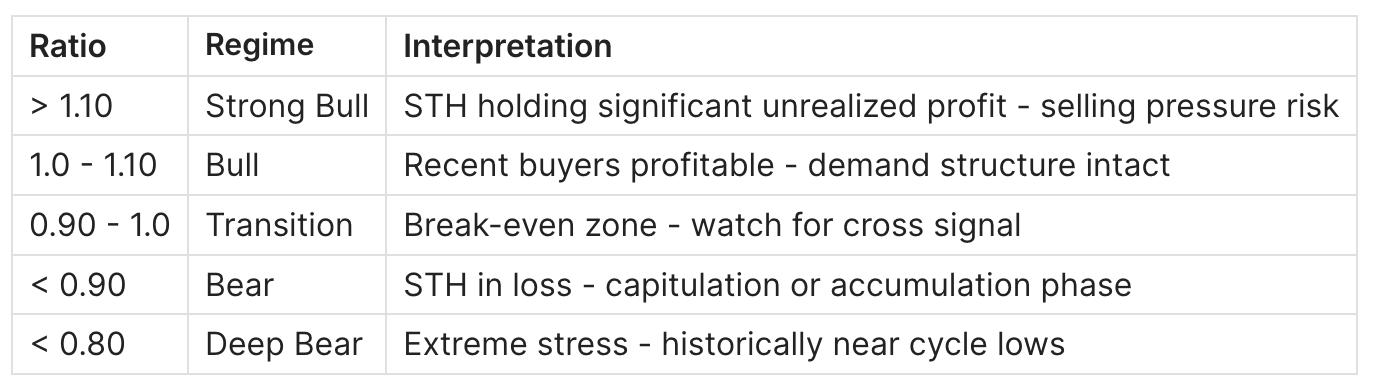
Thresholds:
Signal conditions:
- If
prev_ratio < 1.0ANDcurrent_ratio >= 1.0-> BULLISH CROSS - If
prev_ratio > 1.0ANDcurrent_ratio <= 1.0-> BEARISH CROSS
Examples:
- If STH Ratio crosses from 0.97 to 1.02, that is a BULLISH CROSS - recent buyers just turned profitable; historically this unlocks the next leg up.
- If STH Ratio drops from 1.05 to 0.98 and SMA-30 starts declining, that is a BEARISH CROSS - demand structure breaking down.
SQL Snippet (BigQuery)
CASE
  WHEN prev_ratio < 1 AND sth_profitability_ratio >= 1 THEN 'BULLISH CROSS'
  WHEN prev_ratio > 1 AND sth_profitability_ratio <= 1 THEN 'BEARISH CROSS'
  ELSE NULL
END AS break_even_cross_signal
Use LAG(sth_profitability_ratio) OVER (ORDER BY date) to compute prev_ratio. Aggregate from hourly UTXO age-band data to daily before applying the signal logic to avoid intraday noise.
Key Definitions
Short-Term Holder (STH): Any Bitcoin UTXO that has not moved for less than 155 days (approximately 6 months). This cohort represents recent market participants - the most price-sensitive group.
STH Realized Price: The average cost basis of all STH supply, calculated as the aggregate USD value paid divided by the aggregate coin count. As of March 8, 2026, STH Realized Price stands at approximately $89,028.
STH Profitability Ratio: The ratio of current price to STH Realized Price. A value of 1.0 means the average short-term holder is exactly at break-even. Current value: 0.755 (BTC at $67,175 vs STH RP at $89,028).
Break-Even Cross: The moment the ratio transitions through 1.0 in either direction. This is the primary signal event.
SMA-7 / SMA-30: 7-day and 30-day simple moving averages of the ratio, used to smooth daily noise and confirm trend direction.
How to Interpret This Metric
Bullish case: Ratio rises from below 1.0 and crosses above it. Recent buyers become profitable in aggregate. This removes "sell to break even" pressure and creates conditions for continued upside. The SMA-30 turning upward after a prolonged bear phase is the strongest confirmation. Historically, sustained holds above 1.0 with SMA-30 trending up have corresponded to the markup phase of each cycle.
Bearish case: Ratio falls from above 1.0 and crosses below it. Recent buyers are now underwater. They face the psychological pressure of holding losses, increasing the probability of panic selling into any bounce. When both SMA-7 and SMA-30 are below 1.0 and declining, the regime is confirmed bearish.
Neutral / transitional case: Ratio oscillates between 0.95 and 1.05 with no clear trend in SMA-30. This typically appears during mid-cycle consolidations or after a range-bound market. False crosses are common here - wait for SMA-30 confirmation rather than trading the raw ratio cross.
What matters most: The direction of SMA-30 matters more than a single day's cross. A ratio that pops above 1.0 for 2 days and then fails is noise. A ratio that holds above 1.0 for 2 weeks while SMA-30 turns upward is a structural signal.
Historical Examples
Example 1: January 2023 - Bear Recovery Signal
Period: January 12, 2023
What the metric showed: After spending the entirety of the 2022 bear market below 1.0 (reaching a cycle low ratio of 0.585 on June 18, 2022, when BTC hit ~$19,380), the STH Profitability Ratio printed its first BULLISH CROSS at a BTC price of $18,334 on January 12, 2023.
What happened next: BTC climbed from $18,334 to above $30,000 by April 2023. The ratio held above 1.0 for months, confirming the transition out of the bear regime.
Why it worked: After 9 months of capitulation, the supply overhang from recent buyers had been exhausted. New buyers accumulating near the lows quickly became profitable, removing selling pressure. The cross was not noise - it was a structural shift in demand.
Example 2: October 2023 - Pre-Bull Confirmation
Period: October 16, 2023
What the metric showed: BULLISH CROSS at $27,916. The prior weeks had seen BTC consolidating in the $25,000-$28,000 range. SMA-30 was flat but beginning to turn upward.
What happened next: BTC went from $27,916 to $73,000+ by March 2024 - a 160% move. The October 2023 cross was one of the cleanest pre-bull signals in the dataset.
Why it worked: The cross coincided with early ETF narrative momentum and a clean shift in on-chain structure. LTH supply was near all-time highs (low liquid supply) while STH profitability crossing 1.0 signaled that even recent buyers were now incentivized to hold rather than sell.
Example 3: 2025 Bear - Regime Deterioration
Period: February 25, 2025
What the metric showed: BEARISH CROSS at $89,434. BTC had peaked above $100,000 in late 2024/early 2025. As price pulled back, the STH Profitability Ratio dropped below 1.0. As of March 8, 2026, the ratio stands at 0.755 - meaning the average short-term holder is 24.5% underwater.
What happened next: Price continued declining. The SMA-30 trended downward consistently, confirming the bear regime. No recovery above 1.0 has been achieved through early March 2026.
Why it matters: This illustrates how the bear regime can persist for extended periods. The deeper the ratio falls below 1.0 (currently near the 0.75 area), the greater the capitulation risk - but also the closer to a historically meaningful accumulation zone.
How to Use It in Practice
Setup: Monitor the daily STH Profitability Ratio alongside its SMA-7 and SMA-30. Track the break_even_cross_signal field from your BigQuery pipeline.
Trigger: A BULLISH CROSS event (prev_ratio < 1.0 and current_ratio >= 1.0) OR a BEARISH CROSS event (inverse). The trigger fires on daily close.
Confirm with:
- STH SOPR crossing above 1.0 in the same window (confirms STH are selling at profit, not panic)
- Bitcoin Supply in Profit rising above 75% threshold
- MVRV Ratio trending upward - confirms whole-market profitability improving, not just STH
Invalidates when: Price crosses back through the STH Realized Price level in the opposite direction within 7 days of the signal. A cross that fails within a week is a false signal - the ratio is oscillating in the noise zone.
Action framework:
- BULLISH CROSS + SMA-30 rising + STH SOPR > 1.0: long bias, reduce hedge
- BULLISH CROSS + SMA-30 flat: wait for 7-10 day confirmation hold above 1.0
- BEARISH CROSS + SMA-30 declining: defensive posture, reduce exposure
- Ratio < 0.80 with SMA-30 bottoming: historically near accumulation zones - watch for reversal signal
Time horizon: The regime signal is a multi-week to multi-month indicator. Do not use it for intraday or 1-3 day trades. The SMA-30 confirmation requires patience.
Common Pitfalls
1. Trading raw crosses without SMA-30 confirmation In choppy range-bound markets, the ratio oscillates around 1.0 generating multiple false crosses within days of each other. In September-October 2025 alone, there were 4 cross events within a 31-day window. Filter by requiring SMA-30 to also be on the correct side of 1.0.
2. Confusing level with trend A ratio of 1.05 that is declining is more bearish than a ratio of 0.98 that is rising sharply. The direction of SMA-30 carries more signal than the absolute level. Always visualize both the raw ratio and the 30-day average.
3. Expecting immediate price impact After a BULLISH CROSS, price often retests the STH Realized Price level before rallying. The signal marks a structural shift, not a day-1 price catalyst. The January 2023 cross occurred at $18,334 - price dipped back to ~$19,500 multiple times before the real move began weeks later.
4. Ignoring macro context A BULLISH CROSS in a tightening liquidity environment (rising rates, declining M2) can fail. The signal works best when on-chain structure aligns with macro tailwinds. See Spot ETFs and Global M2 for the macro overlay framework.
5. Misidentifying the STH Realized Price level The STH Realized Price is not the same as the overall Realized Price or the MVRV implied price. It only reflects the cost basis of the last 6 months of activity. LTH cost basis can be far lower, which is why markets can remain in "STH bear" while LTH MVRV is still positive.
6. Applying the same thresholds across all cycle phases During late-stage bull markets, the ratio can remain significantly above 1.0 for months (SMA-30 peaked above 1.6 in early 2021). During deep bears, ratios below 0.80 have historically been near but not exactly at price floors. Use the level as context, not a precision target.
STH Profitability Ratio vs Related Metrics
- STH Profitability Ratio
Measures the aggregate cost basis of Short-Term Holders relative to the current market price.
Time scope: 0-6 months
Best use: Regime identification - STH SOPR
Measures realized profit or loss on transactions made by Short-Term Holders.
Time scope: Daily flow
Best use: Short-term sentiment - MVRV Ratio
Measures the relationship between Bitcoin’s market capitalization and realized capitalization across all holders.
Time scope: All ages
Best use: Cycle top and bottom identification - NUPL
Measures the net unrealized profit or loss of the market as a percentage of market capitalization.
Time scope: All holders
Best use: Sentiment extremes - Supply in Profit
Measures the percentage of the total Bitcoin supply currently held in profit.
Time scope: All ages
Best use: Breadth indicator
STH Profitability Ratio is the cleanest regime signal for recent market participants specifically. MVRV and NUPL include long-term holders who have much lower cost bases and can mask stress among recent buyers. Use STH Profitability as the early-warning layer, MVRV and NUPL as the cycle-stage confirmation.
FAQ
What is the current STH Profitability Ratio? As of March 8, 2026, the ratio is 0.755. BTC is trading at ~$67,175 while STH Realized Price stands at ~$89,028. This means the average short-term holder is approximately 24.5% underwater. SMA-30 is at 0.746, indicating the bear regime is well-established.
What ratio value is considered a danger zone? Sustained readings below 0.85 signal significant STH stress. Below 0.80 has historically appeared near cycle capitulation events. The 2022 cycle low saw a ratio of 0.585 in June 2022. The current 0.755 is approaching historically significant levels but has not yet reached the 2022 extremes.
What is the difference between STH Profitability Ratio and STH SOPR? STH Profitability Ratio reflects unrealized profit/loss - the paper position of all STH supply. STH SOPR reflects realized profit/loss - what was actually captured when coins moved. Both use 0-6 month supply but answer different questions: "are they underwater?" vs "are they selling at a loss?"
Where can I find the STH Realized Price data? CryptoQuant provides the underlying UTXO age-band realized value data. The STH Realized Price used here is calculated from the supply_utxo-age-value-band metric, summing realized supply across the 0-6 month age bands and dividing by the corresponding coin count. See Bitcoin STH Realized Price Definition for the full formula.
Does this metric still work after Bitcoin ETFs? ETF flows introduce a new category of "recent buyer" whose cost basis is tracked through the underlying BTC. As long as ETF inflows are recorded as on-chain UTXO activity (which they are, since ETF custodians hold real BTC), they are captured in the STH supply cohort. The framework remains valid. For more on how ETFs interact with on-chain cycle indicators, see Spot ETFs and Global M2.
How many days does the signal need to hold before acting? A minimum of 7 days above 1.0 after a BULLISH CROSS is a reasonable filter. Better still, wait for the SMA-30 to cross above 1.0 as well, which typically lags the raw cross by 2-4 weeks but significantly reduces false signals.
Is a ratio below 1.0 always bearish? Not necessarily. Brief dips below 1.0 during otherwise healthy bull markets are common and have resolved quickly. The key distinction is whether SMA-30 is above or below 1.0 and whether it is trending up or down. A ratio that dips to 0.97 during a healthy bull with SMA-30 at 1.10 is a very different signal than a ratio trending from 1.10 down to 0.85 with SMA-30 declining through 1.0.
Can the STH Realized Price predict price support levels? Yes, it functions as a dynamic support/resistance level. Price tends to seek the STH Realized Price during corrections (as buyers defend their cost basis) and use it as a launching pad for recoveries. This is the same logic as the Realized Price Bands framework applied specifically to the 0-6 month cohort.
Related Guides
- Bitcoin STH Realized Price: Definition, Formula & Cost Basis Framework - the underlying cost basis metric this ratio is built on
- Bitcoin STH SOPR: What It Is and How to Use It - the flow-based complement to the stock-based profitability ratio
- Bitcoin MVRV Ratio: Definition, Formula & Cycle Signals - whole-market profitability including long-term holders
- Bitcoin NUPL: What It Is and How to Use It - aggregate unrealized profit/loss as a sentiment extremes indicator
- Bitcoin LTH vs STH: Supply Dynamics, Cost Basis & Market Structure - how long-term vs short-term holder dynamics interact
- Bitcoin Supply in Profit: Definition, Thresholds & Market Signals - breadth confirmation for regime signals
- Realized Profit vs Unrealized Profit: What's the Difference - conceptual foundation for cost basis metrics
- The 4-Year Bitcoin Cycle: Definition, Mechanics & Historical Evidence - cycle context for interpreting regime duration
Key Takeaways
- The STH Profitability Ratio break-even cross (1.0 level) is a structural regime signal, not a trade trigger - confirm with SMA-30 before acting
- Current reading of 0.755 (March 2026) places the market in a confirmed bear regime with short-term holders 24.5% underwater on average
- The cleanest signals come after extended periods on one side of 1.0 (as in January 2023 and October 2023) - not during choppy oscillations near the threshold
Next step: understand the underlying cost basis mechanics in Bitcoin STH Realized Price: Definition, Formula & Cost Basis Framework.