
🎧 Morning Brief #166 - audio debate on today’s market setup
Bitcoin has exited the realized loss dominance zone: panic selling no longer defines the market structure. But capital recovery remains very weak compared with the expansion phases in March and December 2024.
TL;DR
The market has passed through the panic selling stage and moved into a recovery phase. But this is not strong risk-on yet: capital is returning too slowly.
Bitcoin Daily Realized Profit Loss Ratio 30DMA
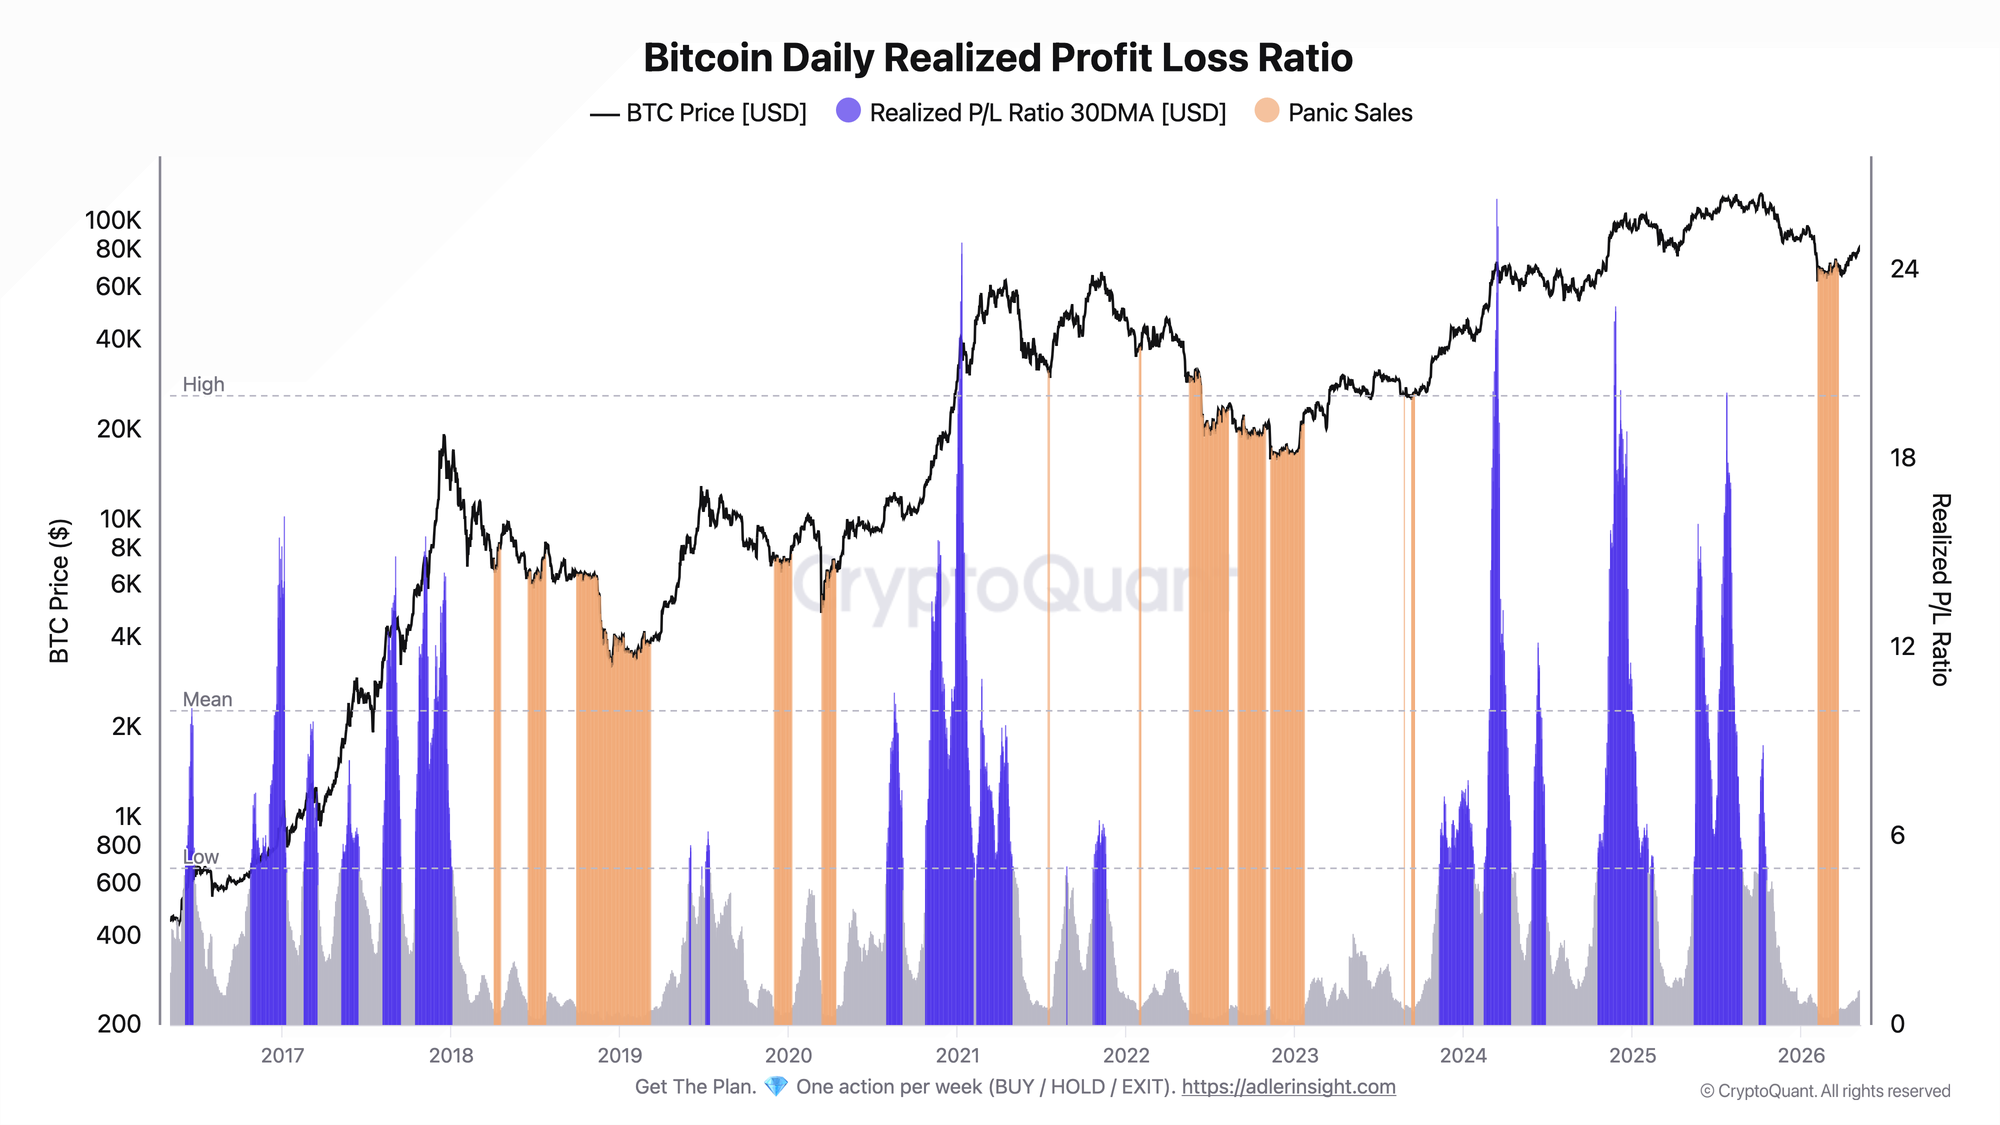
The metric shows the 30-day ratio of realized profit to realized loss. When the ratio falls below 0.5, realized losses dominate profits by at least 2x - this is the panic sales zone.
The latest panic sales zone lasted from February 5 to March 21, 2026. The minimum was reached on February 21 at 0.26, after which the ratio began to recover. By May 10, the value had risen to 1.13, while BTC price on the chart was holding around $80K.
This is a strong shift: the market is no longer in a forced loss-taking regime. But exiting panic sales on its own does not equal full bull confirmation - it means the capitulation phase is over, not that a new impulse has already been fully confirmed.
Bitcoin: Realized Cap Net Position Change 30DMA
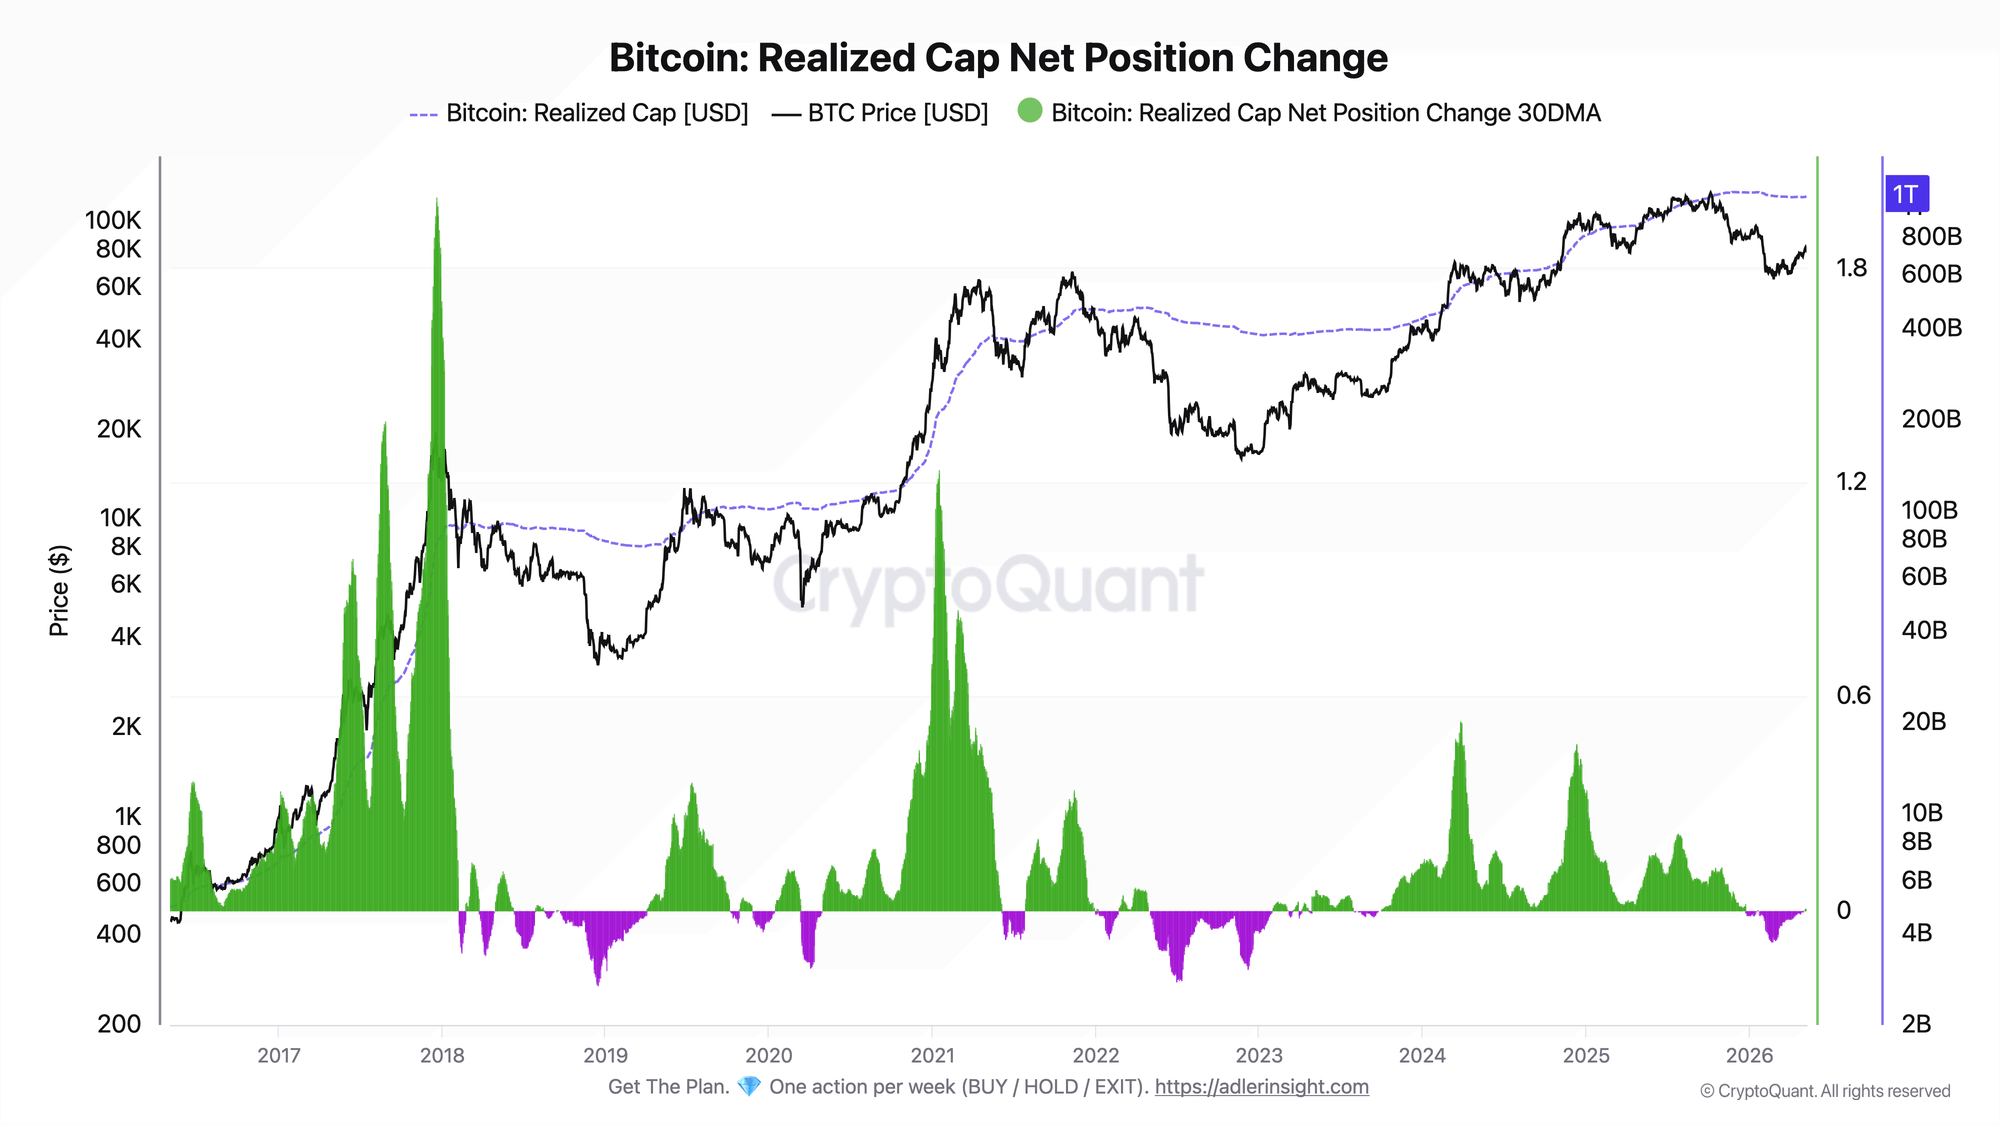
The metric shows the 30-day average of the daily change in realized cap. A value above zero means the realized capital base is expanding; a value below zero means the network’s capitalization by realized cap continues to contract.
In February 2026, the metric reached a low of -0.087% on February 20. It crossed back above zero on May 2, and by May 10 the value was only +0.008%. Formally, this is recovery, but the scale is very small: the March 2024 peak was +0.534%, and the December 2024 peak was +0.472%, meaning the current recovery is roughly 98% weaker than those expansion phases.
This confirms that the market has exited capital contraction, but has not yet returned to strong realized capital inflow. The main conclusion: panic is gone, but capital has not yet returned in the volume that characterized the strong phases of 2024.
The link between the two charts is simple: the first chart shows that panic sales are over, while the second shows that capital recovery has only just begun. The current regime is recovery after capitulation, but not yet full broad capital expansion.
Outperform Buy & Hold with a rules-based strategy - Start free. One weekly action, clear triggers, and invalidation levels. No guessing.
FAQ
Why is this not a full bullish signal?
Because the realized profit/loss ratio has already exited the panic zone, but realized cap net position change remains too weak. The market has stopped selling at a loss, but new capital is still returning slowly.
What is the main trigger confirming recovery?
The main trigger is a sustained hold of realized cap net position change above zero with acceleration. If the metric falls back below zero, it would mean that the capital recovery has failed.
CONCLUSIONS
Bitcoin has passed through the panic sales phase: realized losses no longer dominate, and the realized profit/loss ratio has recovered above the stress zone. But Realized Cap Net Position Change 30DMA shows that capital is returning extremely slowly: the current value is positive, but roughly 98% weaker than the March and December 2024 peaks. That is why the current regime is neutral-recovery: stress has been removed, but strong risk-on has not yet been confirmed; the main trigger is acceleration in realized cap above zero, and the main risk is a return of the metric into negative territory.
Further Reading