
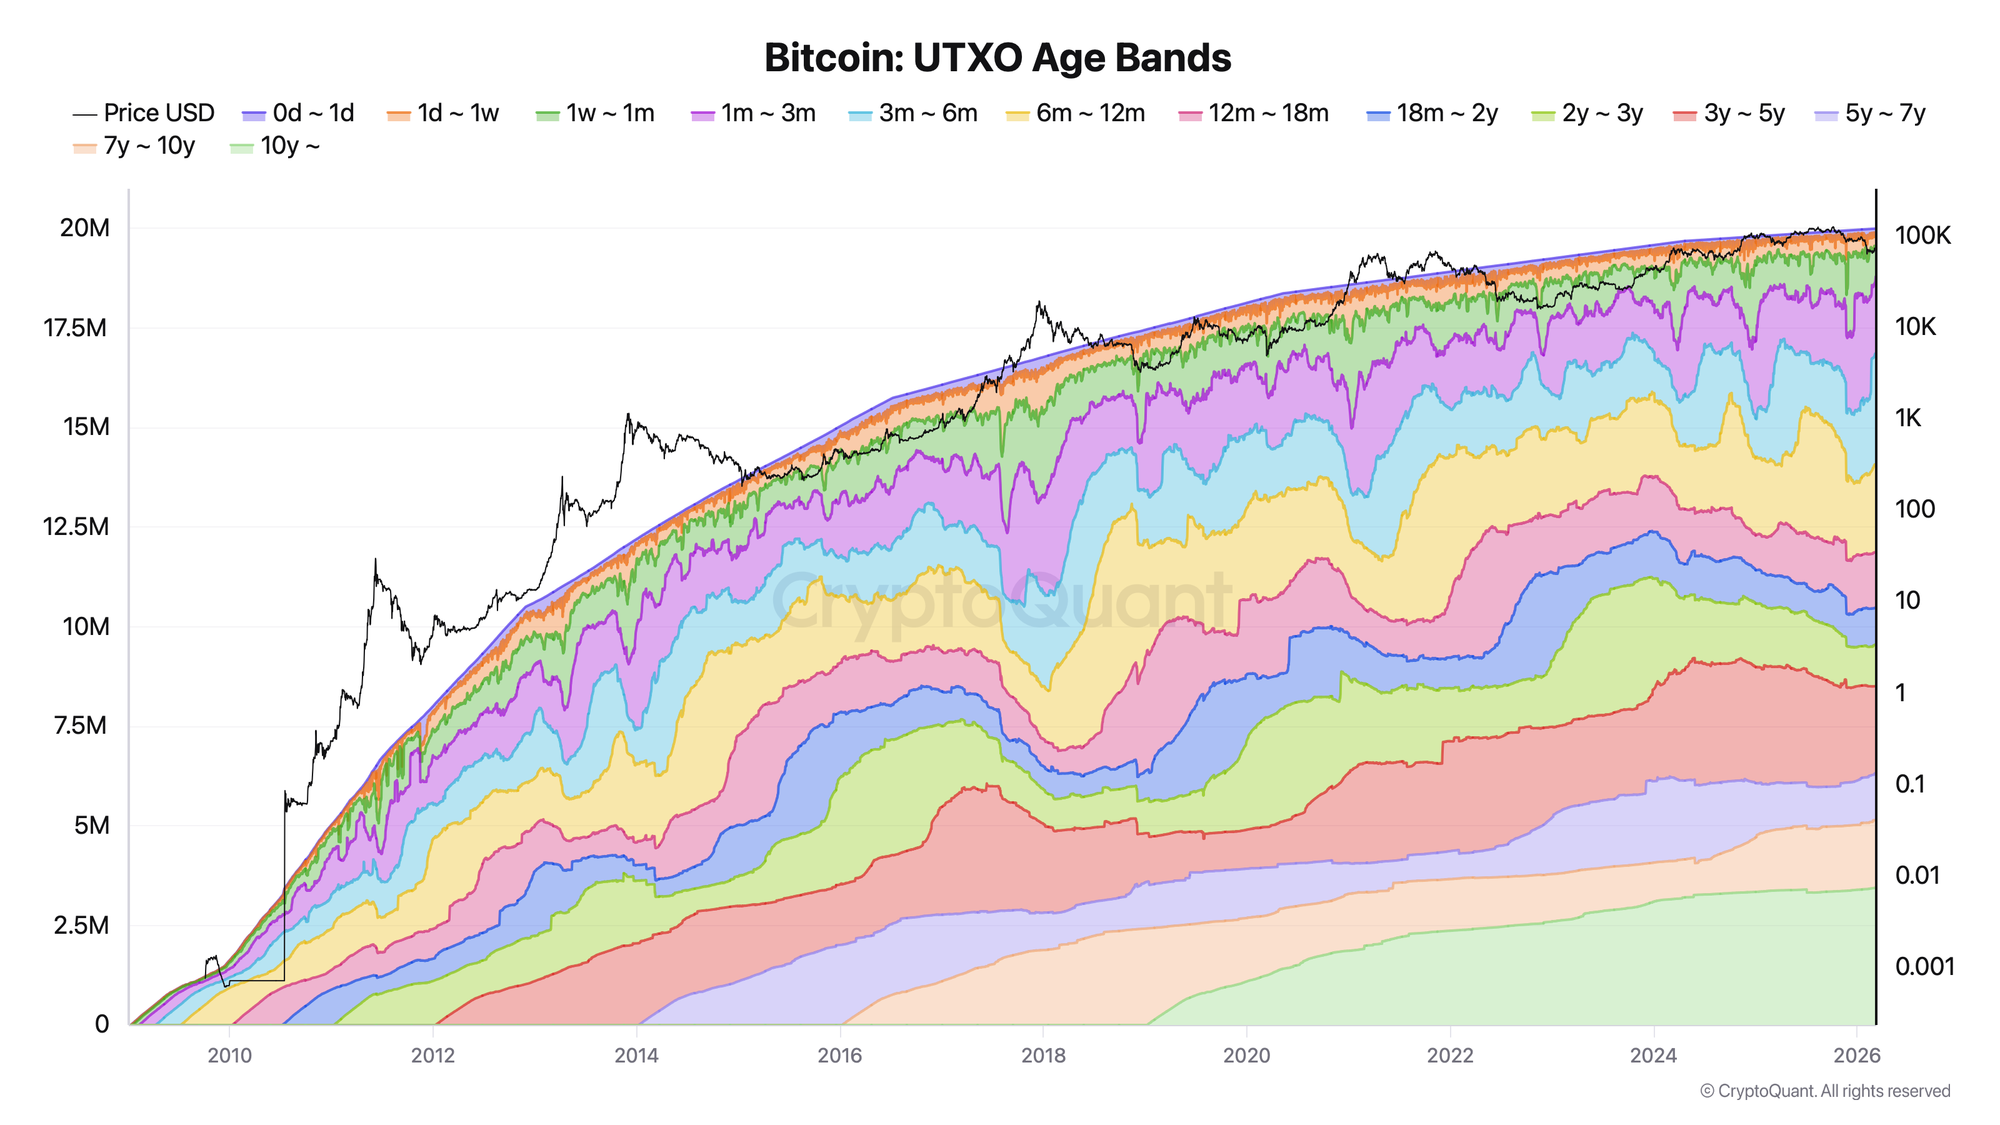
Realized Price by UTXO Age Bands shows the average acquisition price of Bitcoin UTXOs grouped by holding duration - from coins last moved hours ago to coins dormant for over ten years. It answers a question no price chart can: who is sitting on gains, who is underwater, and which cohort is most likely to sell next.
TL-DR
- What it is: The average price at which UTXOs within each age bracket were last transacted, expressed in USD.
- How it is calculated: For each age band, sum (price at last move x coin amount) and divide by total coins in that band.
- Rising band: Average cost basis of that cohort increases - new buyers at higher prices are dominating the band.
- Falling band: Older, higher-cost UTXOs are aging out of the band or being spent at a loss - potential capitulation signal.
- Main practical use: Short-term bands (1w-3m) act as dynamic support/resistance levels; long-term bands (1y+) anchor macro cycle structure.
- Context caveat: Exchange internal transfers and OTC settlements can inflate short-term band readings without reflecting genuine new demand.
Signal rule: When spot price holds above the 1m-3m realized price band after a pullback, the short-term holder cohort remains in profit - historically a recovery confirmation. When spot price drops below 1w-1m band, STH capitulation risk rises sharply.
The Signal Rule
Core condition:
Price > RP[1m-3m]  → STH cohort in profit, bullish continuation bias
Price < RP[1w-1m]  → STH cohort underwater, elevated sell pressure
Price < RP[3m-6m]  → Mid-term holders squeezed, watch for flush
Price > RP[6m-12m] → 6-12m cohort re-enters profit, distribution risk rises
Thresholds that matter:
- 1w-1m band: fastest-reacting band; flips within days of price moves
- 1m-3m band: reliable STH support in uptrends; break = local bearish signal
- 3m-6m and 6m-12m: mid-term holder cost basis; convergence with spot price marks decision zones
- 1y-2y+ bands: macro floor and long-term holder conviction anchors
Interpretation:
- Bullish: Spot holds above 1m-3m band on a retest; LTH bands (1y+) slope upward = accumulation in prior cycle phase.
- Bearish: Spot falls through multiple bands in succession; short-term bands converge toward mid-term bands = broad cohort pain.
- Neutral: Spot oscillates around 1m-3m band with no directional resolution; wait for confirmation from volume or another metric.
Examples:
- If 1m-3m band = $82,000 and spot rebounds from $83,500, that band provided support - bullish continuation.
- If spot closes below 1w-1m band ($74,000) two sessions in a row, STH holders are printing losses - watch for accelerating sell-off.
Key Definitions
UTXO (Unspent Transaction Output): The discrete unit of Bitcoin accounting. Every unspent output carries a timestamp (when it was created) and an implicit price (what BTC was worth at that moment).
Realized Price (cohort-level): The supply-weighted average of the last transaction price for all UTXOs in a given age bracket. Unlike spot price, it does not move until coins actually move on-chain.
Age Band: A time window defining how long a UTXO has been dormant since its last on-chain move. Standard bands: 0d-1d, 1d-1w, 1w-1m, 1m-3m, 3m-6m, 6m-12m, 12m-18m, 18m-2y, 2y-3y, 3y-5y, 5y-7y, 7y-10y, 10y+.
Band Migration: When coins are spent and re-created, they reset to the youngest band (0d-1d) at the current price. Dormant coins age into older bands passively over time.
LTH vs STH Threshold: Conventionally, 155 days (~5 months) separates Short-Term Holders from Long-Term Holders. In age-band terms: bands below 6m are predominantly STH territory; 6m+ increasingly reflects LTH conviction.
How to Interpret This Metric
Bullish case
Young bands (1w-3m) rise in price but remain below spot - this means recent buyers are in profit and have no forced-sell pressure. If, at the same time, older bands (2y+) show high realized prices, it confirms that prior cycle participants accumulated well and are unlikely to panic. The stack of bands below spot acts as a layered support structure.
Bearish case
Short-term bands (1w-1m) spike upward toward spot - new entrants bought near the top. If price then reverses, these bands flip from below-spot (in profit) to above-spot (in loss) quickly. When 1m-3m band also crosses above spot, the second cohort layer joins the pain. Historically, multi-band crossovers above spot signal elevated capitulation risk.
Neutral case
Bands are tightly clustered with spot oscillating through them. This indicates range compression - no cohort has a strong profit or loss incentive to move coins decisively. Often precedes a breakout but offers no directional bias on its own.
What matters most
Trend of each band relative to spot, not the absolute USD value. A band at $50,000 means nothing without knowing whether spot is $48,000 (band above spot = pain) or $85,000 (band well below spot = comfort). Timeframe matters too: short-term bands resolve in days to weeks; macro signals from 1y+ bands unfold over months.
Historical Examples
Example 1 - November 2022 Capitulation Floor
Period: October-November 2022 (FTX collapse)
What the metric showed: The 1w-1m and 1m-3m realized price bands were sitting around $19,000-$21,000 - close to spot. The convergence meant nearly every recent buyer was at or below breakeven. When spot broke to $15,500, all short-term bands moved above spot simultaneously.
What happened: That multi-band crossover (spot below 1m-3m and even 3m-6m bands) marked the final capitulation low of the 2022 bear market. By January 2023, as spot recovered, bands sequentially returned below spot - a textbook band-stack repair.
Why it worked: The metric provided structural evidence that selling pressure was becoming exhausted - there were few remaining profitable short-term holders left to sell. The CSV data confirms: on 2022-11-21, the 18m-2y band stood at ~$25,474, well above spot, reflecting the large cohort that bought in late 2020 to early 2021 and was holding through the drawdown.
Example 2 - March 2024 Pre-Halving Distribution
Period: February-March 2024 (Bitcoin approached prior ATH ~$69k)
What the metric showed: The 6m-12m band ($26,000-$30,000 range) and 12m-18m band (~$28,000) were far below spot near $65,000-$68,000. Coins acquired during mid-2023 accumulation were deeply in profit.
What happened: These bands provided no immediate resistance - holders were sitting on large unrealized gains and not yet distributing. Price pushed through to a new ATH above $73,000 in March 2024. The real distribution signal came only when 1m-3m band started climbing steeply toward spot in Q2 2024, indicating late buyers at elevated prices.
Why it worked: Wide spread between spot and all mid-term bands = "air pocket" above previous support = momentum environment. Data confirms: on 2024-03-01, the 3m-6m band was near $30,000 while spot was ~$68,000 - a 55% cushion for that cohort.
Example 3 - Current Reading (March 2026)
Period: Early March 2026
What the metric shows: As of 2026-03-08, key bands from the CSV data:
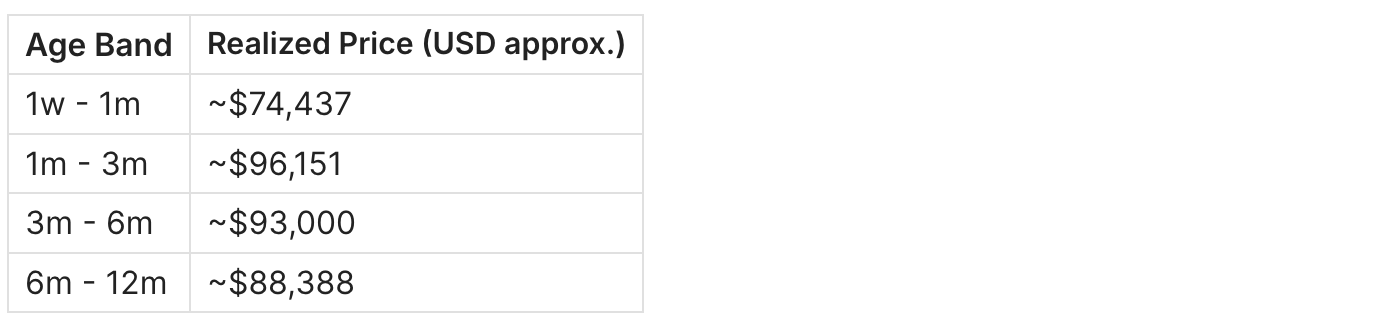
The 1m-3m band at ~$96,151 sits above the 3m-6m and 6m-12m bands, meaning buyers from 1-3 months ago have the highest cost basis among STH cohorts - a signal of recent distribution into those buyers. Long-term bands (3y-5y: ~$29,900; 5y-7y: ~$18,900) remain deeply below any plausible spot level, confirming LTH cohort has no sell pressure from cost-basis mechanics.
Context: If spot is below the 1m-3m band (~$96k), this cohort is underwater - watch for STH capitulation dynamics similar to late 2021 / early 2022 patterns.
How to Use It in Practice
Setup: Pull daily realized price values for at minimum four bands: 1w-1m, 1m-3m, 3m-6m, 6m-12m. Plot against spot price on a log-scale chart.
Trigger: Spot closes back above the 1m-3m band after trading below it for 3+ days.
Confirm: Cross-check with Bitcoin STH SOPR returning above 1.0 on the same timeframe. Optionally confirm with Exchange Netflow showing outflows (coins leaving exchanges = accumulation bias).
Invalidates when: Spot closes below the 3m-6m band on elevated volume - signals a deeper cohort under pressure, downtrend likely extending.
Action: Use band levels as dynamic cost-basis support zones for entries in an uptrend. Do not use them as hard stop-loss levels; combine with price action confirmation.
Time horizon: Signals from 1w-1m bands resolve in days to 2 weeks. Signals from 3m-6m+ bands are relevant over weeks to months. LTH bands (1y+) are macro context, not trade triggers.
Common Pitfalls
1. Confusing band migration with genuine demand When miners or exchanges move coins internally, UTXOs reset to the youngest band at the current price. This can artificially elevate short-term bands. Filter: cross-reference with Miner Reserve data to separate miner-driven noise.
2. Using a single band in isolation A band crossing above spot is meaningful only if multiple adjacent bands confirm the same structure. One band breach in a rising market can be a simple consolidation artifact.
3. Ignoring the direction of band movement A 1m-3m band rising toward spot may still be below spot (bullish structure intact) or above spot (bearish). Always check the relative position, not just the trend direction.
4. Applying STH-band signals to LTH time horizons Short-term band signals (1w-1m) are noise on a multi-month chart. Mixing timeframes leads to contradictory interpretations. Keep signal timeframes consistent with the band you are analyzing.
5. Post-ETF structural shift in short-term bands Since spot Bitcoin ETF approval (January 2024), institutional creation/redemption flows generate large UTXO movements that reset young bands without reflecting retail behavior. Short-term bands have become noisier as a result. Weight 1m+ bands more heavily than sub-1m bands for directional signals.
6. Treating dormant coin bands as guaranteed floor The 5y-7y or 7y-10y bands show very low realized prices (well below any recent market price), but those coins are unlikely to move regardless of price pressure. Do not model them as a "support floor" - they are structural background, not dynamic support.
Realized Price by UTXO Age Bands vs. HODL Waves
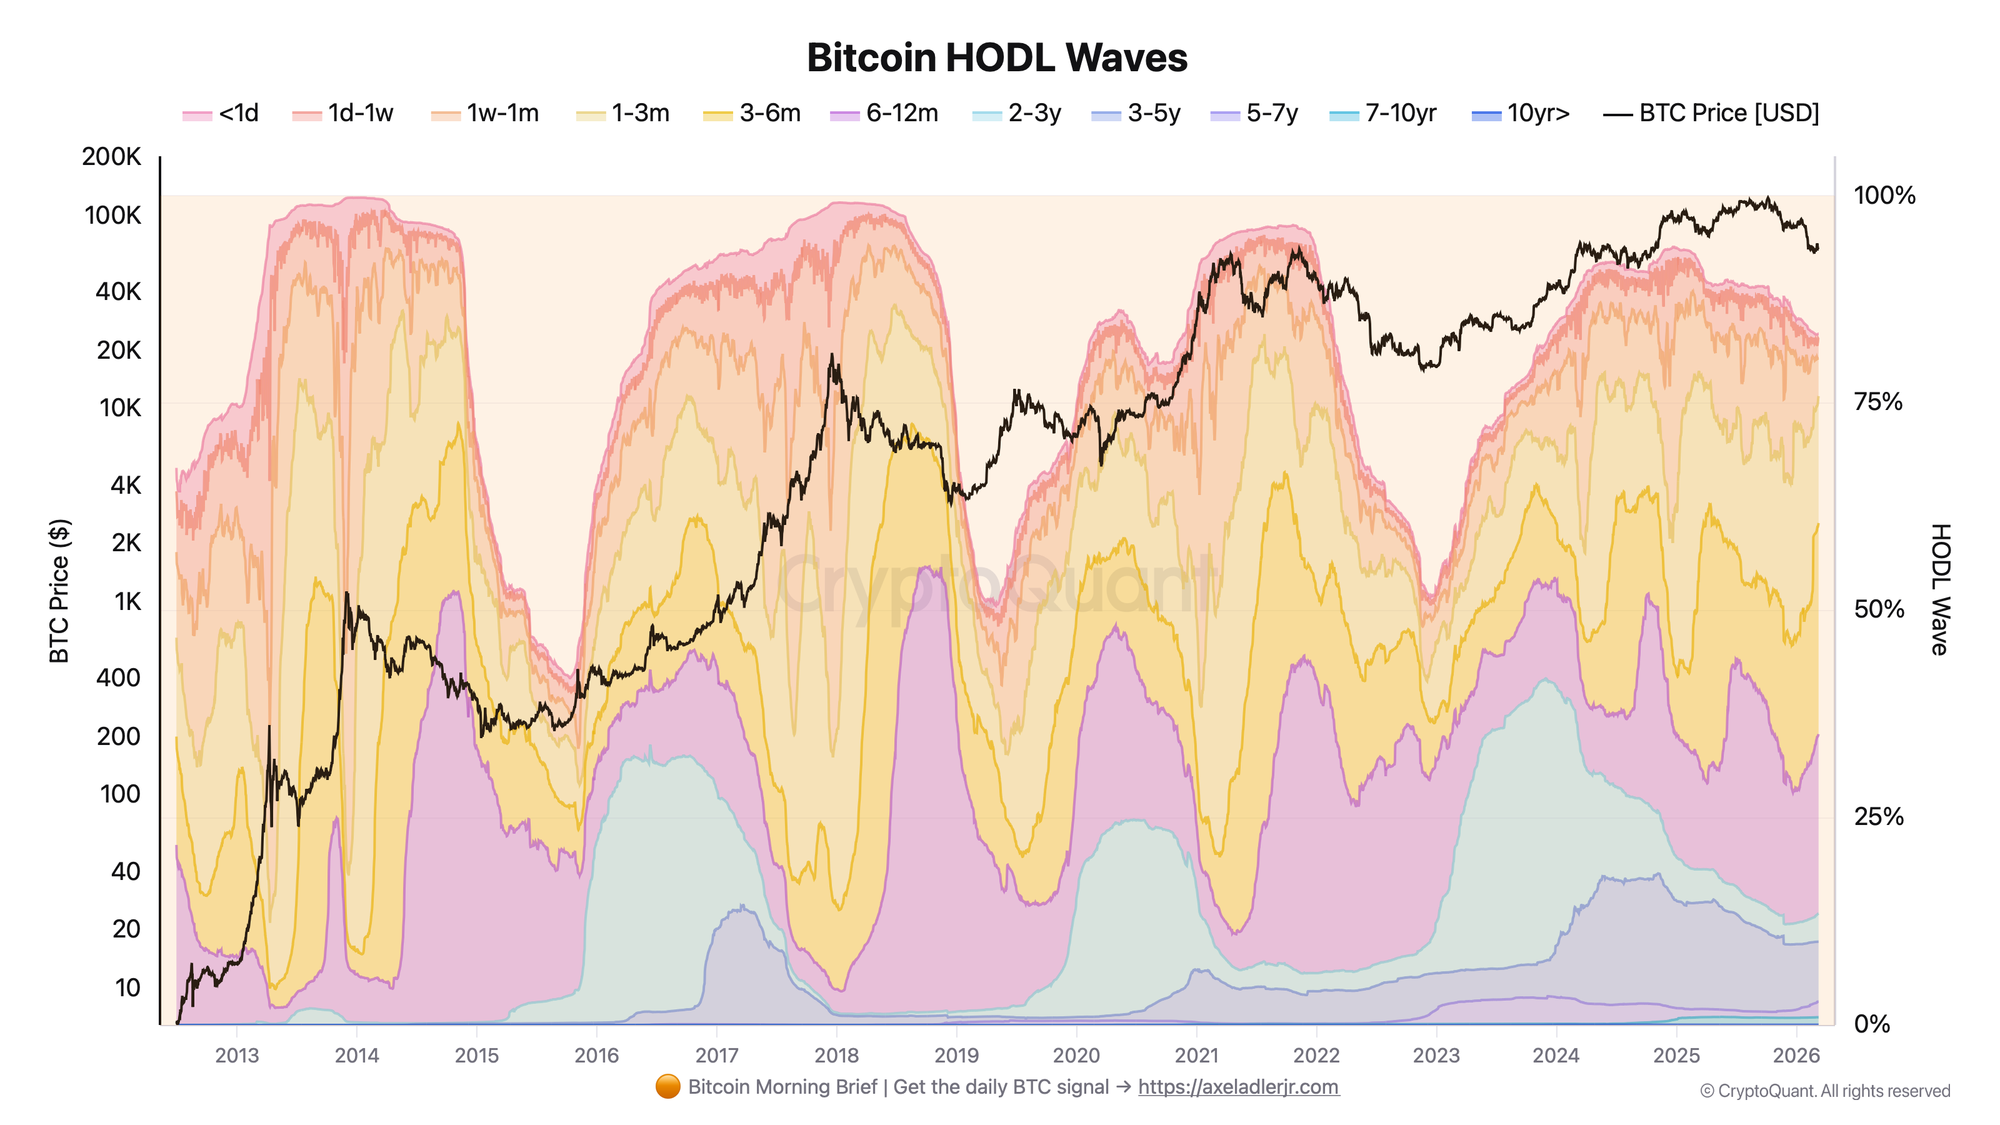
Both metrics use the same underlying UTXO age segmentation. The key difference:
- HODL Waves show the percentage of supply held in each age band - useful for reading accumulation vs. distribution momentum by volume of coins.
- Realized Price by Age Bands shows the average cost basis of each cohort - useful for reading profit/loss states and identifying support/resistance levels.
Use HODL Waves to answer "are LTHs accumulating or distributing?" Use Realized Price Age Bands to answer "at what price are those LTHs sitting, and does that create selling pressure?" The two metrics are complementary, not substitutes. A rise in the young-band share of HODL Waves combined with rising realized prices in those same young bands = aggressive short-term speculation - historically a late-cycle warning.
FAQ
What is a "significant" band crossing above spot? Any band with holding duration of 1 month or more crossing above spot carries meaningful signal weight. Sub-1-week bands fluctuate daily and generate false signals frequently. The 1m-3m band above spot is the most-cited critical threshold in cycle analysis.
Where can I find this data? CryptoQuant provides Realized Price UTXO Age Bands data via its market indicators section. Glassnode offers a similar segmentation under "UTXO Realized Price Distribution." The raw UTXO-level data is extractable via BigQuery public datasets for custom SQL analysis.
Does this metric still work after spot ETFs? Yes, but with caveats for short-term bands. ETF custodian flows (mainly Coinbase Prime) create large UTXO resets that add noise to 0d-1w and 1w-1m bands. Bands of 1m+ are less affected and retain strong signal value. The structural relationship between spot and mid/long-term bands has not changed post-ETF.
How does this differ from the STH Realized Price? STH Realized Price is an aggregate cost basis for all coins held under 155 days - it blends all short-term cohorts into one number. Realized Price by Age Bands separates that aggregate into its constituent buckets (1w-1m, 1m-3m, 3m-6m), giving much finer resolution on which specific short-term cohort is stressed.
How does it relate to MVRV? MVRV Ratio uses the network-wide Realized Price as the denominator. Realized Price Age Bands let you reconstruct a cohort-level MVRV - dividing spot by any specific band's realized price gives you that cohort's unrealized profit multiple. This is more actionable than the blended network-wide figure.
Can I use this for swing trading? Short-term bands (1w-1m, 1m-3m) provide swing-relevant support/resistance levels. However, they should be used as context for entries, not as precise stop-loss triggers. Combine with STH SOPR and price action confirmation to improve timing.
What happens to LTH bands during bear markets? LTH bands (1y+) tend to rise slowly during bear markets as coins that were bought at high cycle prices age into longer-duration bands. This creates a "cost-basis ceiling" above market price that resolves only when those cohorts either sell (realizing loss/gain) or when price recovers above those bands over a multi-year horizon.
Related Guides
- Bitcoin STH Realized Price: Definition, Formula & Cost Basis Framework - the aggregate version of short-term cohort cost basis
- Bitcoin LTH vs STH: Supply Dynamics, Cost Basis & Market Structure - how the two holder classes interact structurally
- Bitcoin MVRV Ratio: Definition, Formula & Cycle Signals - network-wide unrealized profit framework that uses realized price as denominator
- Bitcoin STH SOPR: What It Is and How to Use It - the best confirmation metric for STH-band signals
- Bitcoin NUPL: What It Is and How to Use It - complements age-band analysis with a market-wide profit/loss sentiment read
- Coin Days Destroyed (CDD) & Liveliness - tracks when dormant long-term holders actually move, providing the "action" signal that age bands anticipate
- Bitcoin Realized Price Bands Explained - broader context on realized price as a framework
- Bitcoin VDD Multiple: Cycle Top Signals - uses coin-age-weighted value destruction to identify distribution peaks across all cohorts
Key Takeaways
- Realized Price by UTXO Age Bands maps the cost basis of each holding cohort separately - it is more precise than aggregate STH/LTH realized price and reveals which specific group is under pressure at any given price level.
- The 1m-3m band is the most actionable threshold: when spot holds above it in an uptrend, the dominant short-term cohort has a profit buffer and sell pressure is reduced; when spot falls below it, STH capitulation risk rises significantly.
- LTH bands (1y+) function as macro context, not trade triggers - they anchor cycle structure and confirm whether long-duration holders are comfortable or stressed, but they move slowly and do not produce short-term timing signals.
Next step: pair this metric with STH SOPR for confirmation of band-level signals in real-time.